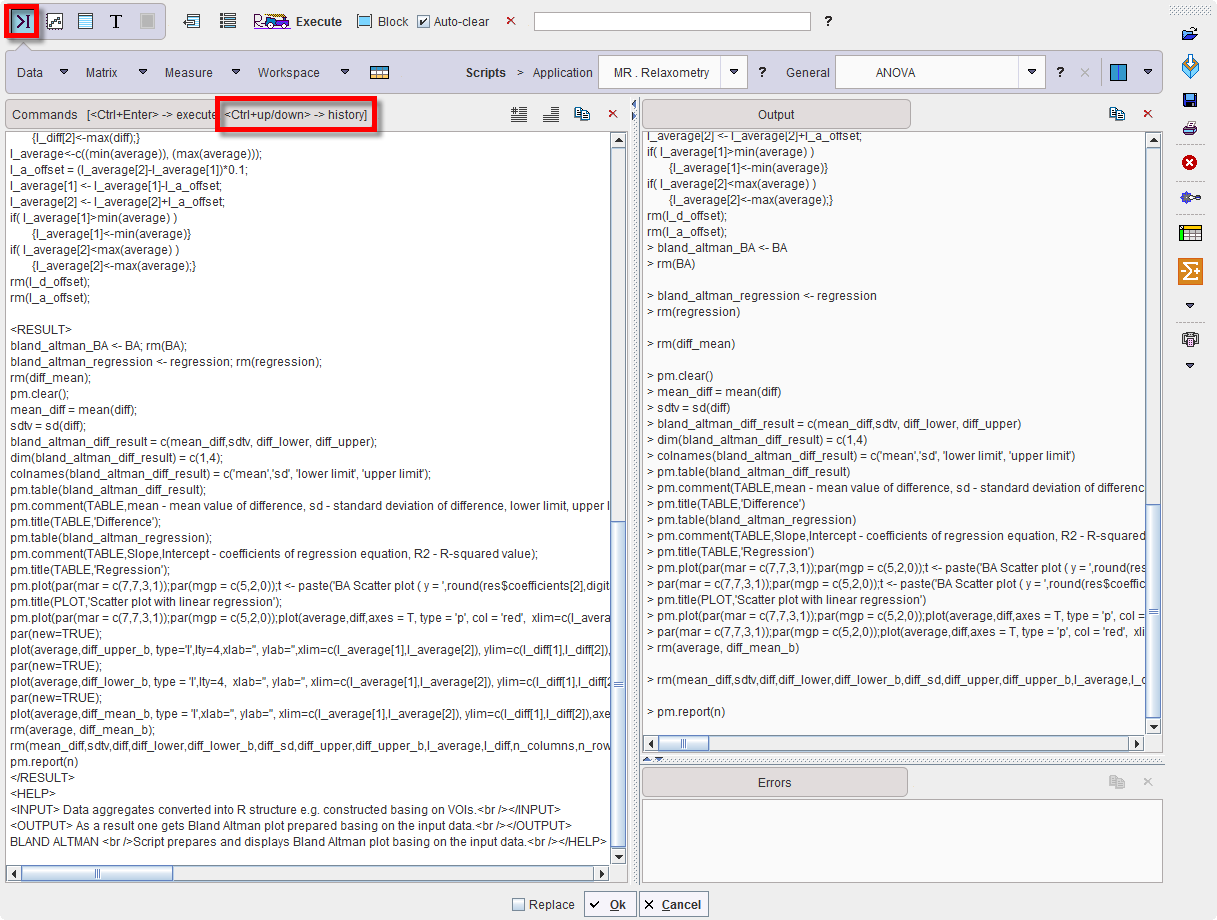
The command window provides a graphic user interface for developing and executing R commands and scripts. The illustration below shows the organization using the horizontal layout.

Commands Area
The Commands area serves the following purposes:
Output Area
Connecting to the server localhost ... Connected.
Loading default settings ... Loaded.
R version 3.4.2 (2017-09-28) Windows
Loading input data 1/2 ... Loaded.
Loading input data 2/2 ... Loaded.
> summary(g1);
Length Class Mode
vt 16 data.frame list
> ls();
[1] "g1" "g2" "pm.getc" "pm.gete" "pm.getf"
[6] "pm.geti" "pm.getm" "pm.getp" "pm.getr" "pm.getslc"
[11] "pm.getv" "pm.getx" "pm.mutualc" "pm.mutualr" "pm.mutualrc"
[16] "pm.setc" "pm.setm" "pm.setp" "pm.setr" "pm.setslc"
[21] "pm.size" "pm.sortc" "pm.sortr" "pm.sortrc" "pm.trim"
[26] "zz"
Errors Area
Please check the contents of the Errors area, if the behavior of the R console is unexpected.
PMOD R Commands and Code Generator
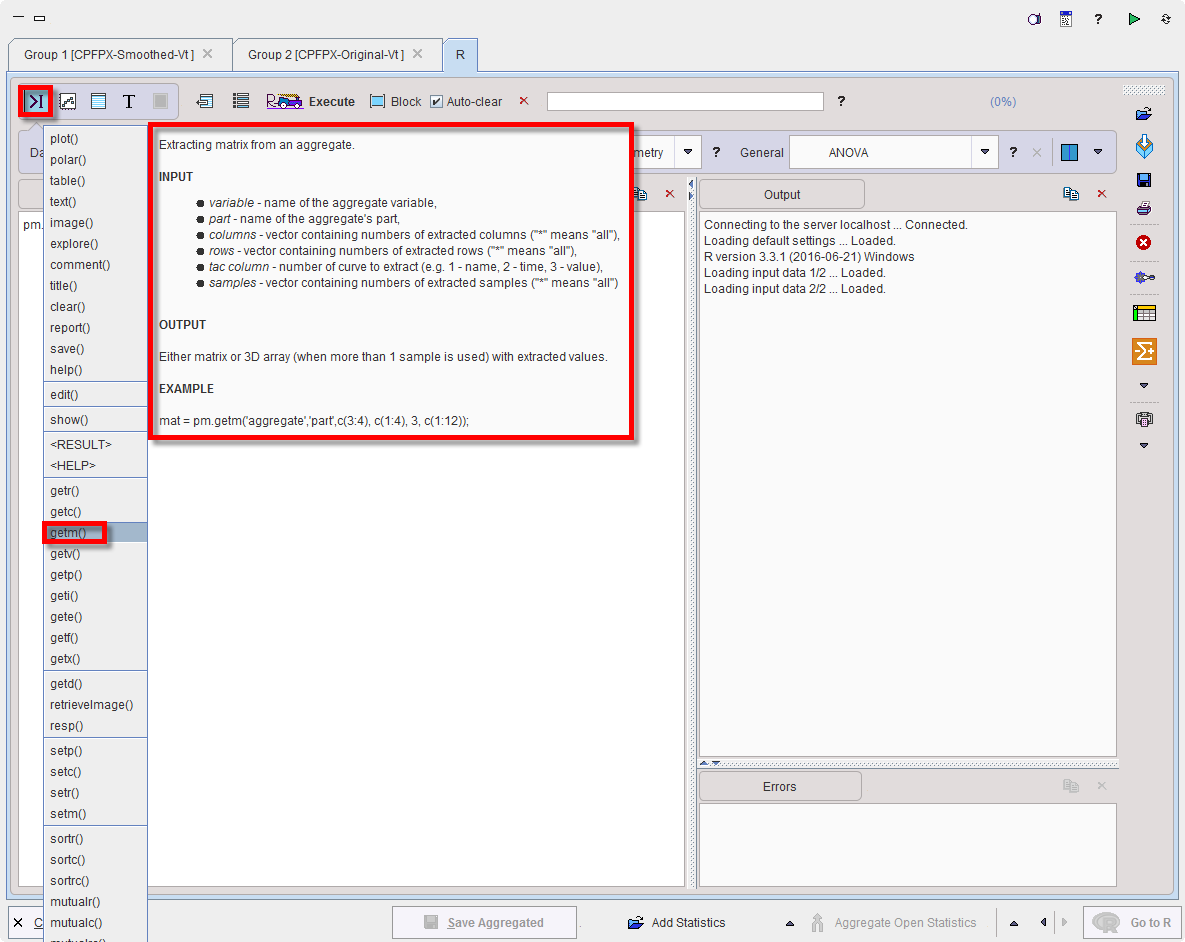
PMOD has implemented a set of commands dedicated to the PMOD Command console. This commands list is accessible typing the pm. in the Command console. Their description is available upon selection from the pop-up menu as shown below:

|
Allows:
|
|
Basic operations on matrices.
|
|
Allows applying predefined statistic operations to the variables available in the workspace.
|
|
Allows performing various quick operation like listing (ls()), removing(rm()) and accessing the summary (summary()) of the variables available in the workspace. The results are displayed in the Output console.
|
|
Allows editing a variable available in the workspace. Upon activation the list of variables available in the workspace is displayed. The data type is detected automatically. Two options are available: either Choose variable or Define expression.
The user can decide which Part of the selected variable has to be edited: Time or Value. The confirmation of the settings opens a dialog window which allows performing the editing.
There are four ways to replace with the specified Value the content of the displayed table:
Once the method is selected and all the parameters specified the Set to button allows setting the new Value in the table. Activate the Create new variable checkbox and specify a name in order to avoid overwritting the original variable. Close the dialog window with the OK button. |
|
Allows selecting and running general predefined R scripts. Detailed information of the scripts is available in the dedicated section in this documentation. The predefined scripts are available for selection with the small arrow closed to the button. To add a R script to the predefined list, please copy the *.r file in the Pmod installation folder in C:\Pmod3.9\resources\extlibs\r
If any help section was included in the script this can be visualized activating the ? icon close to the scripts selection list. |
|
Allows deleting a script from the scripts predefined list. |
|
Allows switching between the two layout options: horizontal and vertical.
|
|
Allows commenting the command lines. First, the lines have to be selected and the icon activated.
|
|
Allows uncommenting the selected command lines in the command console. First, the lines have to be selected and the icon activated. |
|
In the Commands console: allows copying commands console to the clipboard. In the Output console: allows copying output content to clipboard. In the Errors console: allows copying the errors messages to the clipboard. |
|
In the Commands console: allows deleting the content of the command console. In the Output console: allows clearing the output content . In the Errors console: allows deleting the errors messages. |