![]()
![]()
![]()
![]()
|
|
|
|
|
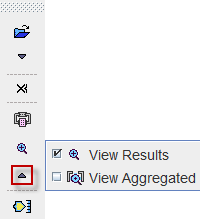
The analysis results are available from the lateral task bar
Results Summary
The  button opens a window which assembles all the results:
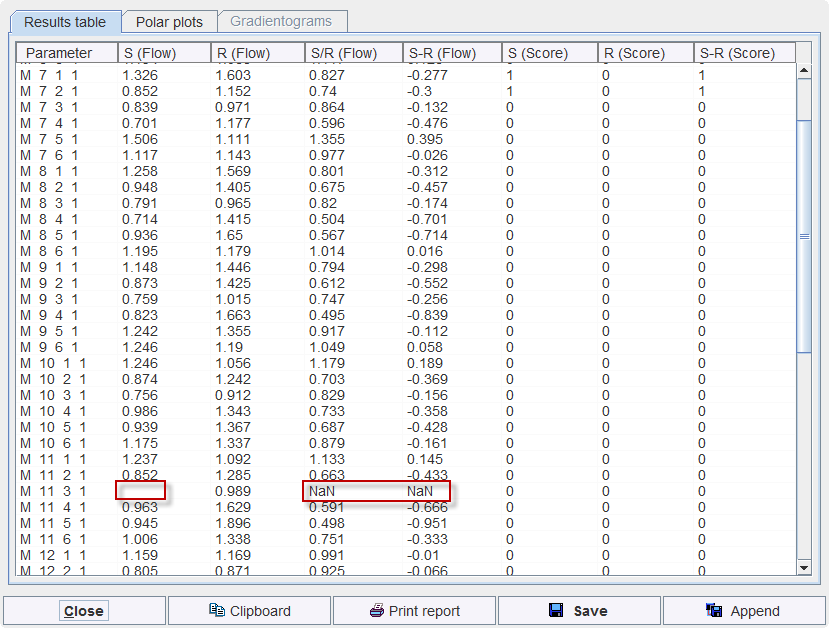
The numeric results are available on the Results table page. For each cardiac segment the results are listed in a row:
The values can be copied to the Clipboard for pasting into a different program like MS Excel, Printed, Saved into a text file, or Appended to a previously saved result. A saved
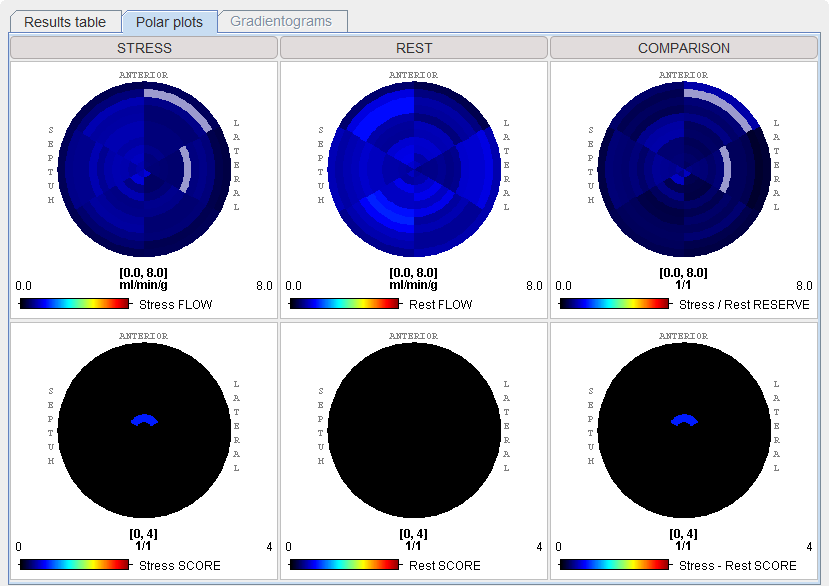
The Polar plots page visualizes the results as polar plots.
The Gradientogram visualizes the change of the perfusion across the myocardial wall. It is calculated as the difference between the inner- and outermost segment. Naturally it is only available if the segmentation distinguishes between several transmural segments. In this case the following arrangement is shown:

A plot is shown for each quantified slice. The illustration above shows the GRADIENT plots of 9 slices. Each plot shows the values around 360° along the y-axis, and along the dynamic acquisitions along the x-axis. Note that the gradientograms of the Stress and Rest studies are fused. Their relative emphasis can be changed with the fusion slider.
Results Viewer
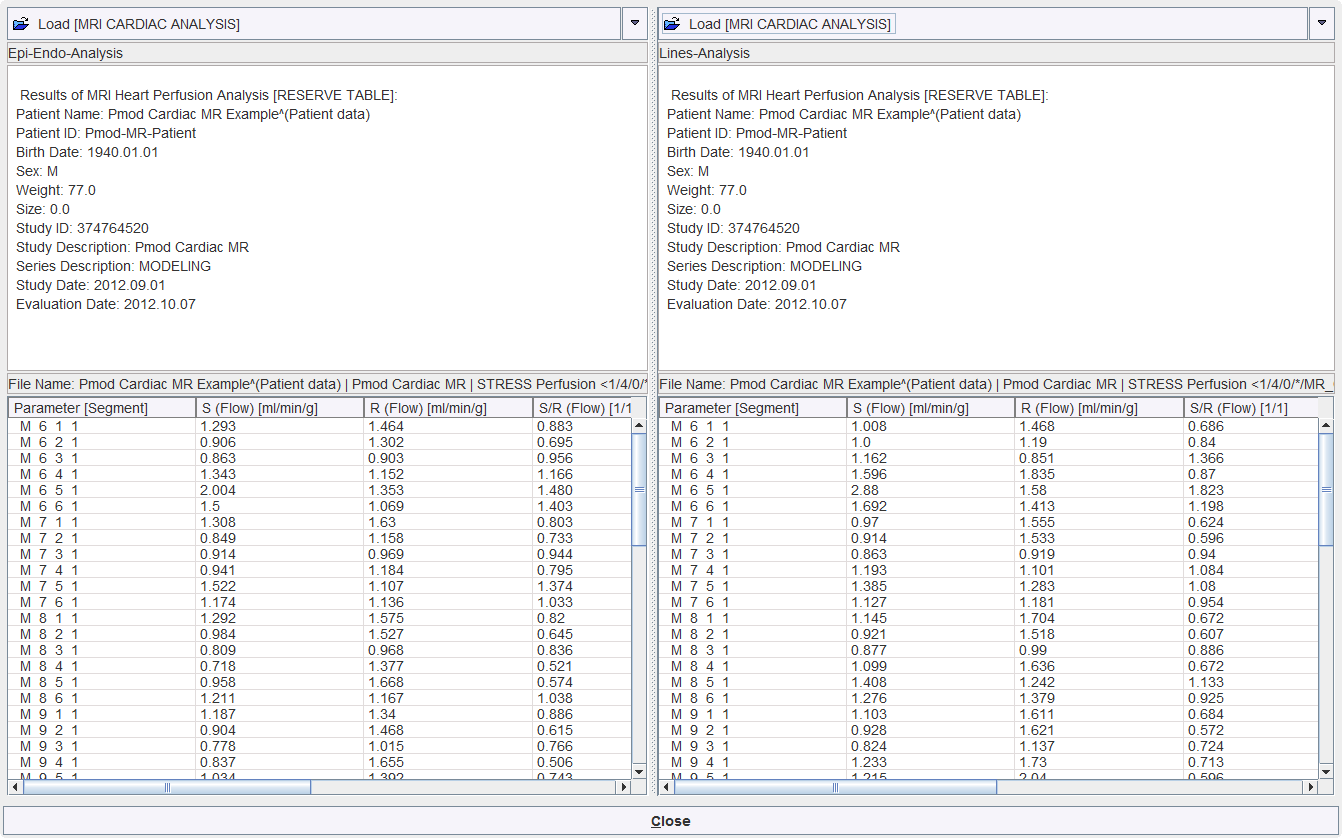
Saved results can be viewed with the ![]() View Results button. It opens a dialog viewer, showing the selected result to the left. With the Load button in the upper right, an additional result can be opened so that they can be compared side by side as illustrated below.
View Results button. It opens a dialog viewer, showing the selected result to the left. With the Load button in the upper right, an additional result can be opened so that they can be compared side by side as illustrated below.
Results Aggregation
Results aggregation can be used for assembling the PCARDM results saved with the Save button. For instance, the results when applying different quantification models or heart segmentation schemes can be assembled for statistical analysis.
Aggregation is started with the  button. It opens a window which allows selecting previously saved results. In the example below the results of two segmentations are compared. Note that the number of segments resulting from both methods must be the same.
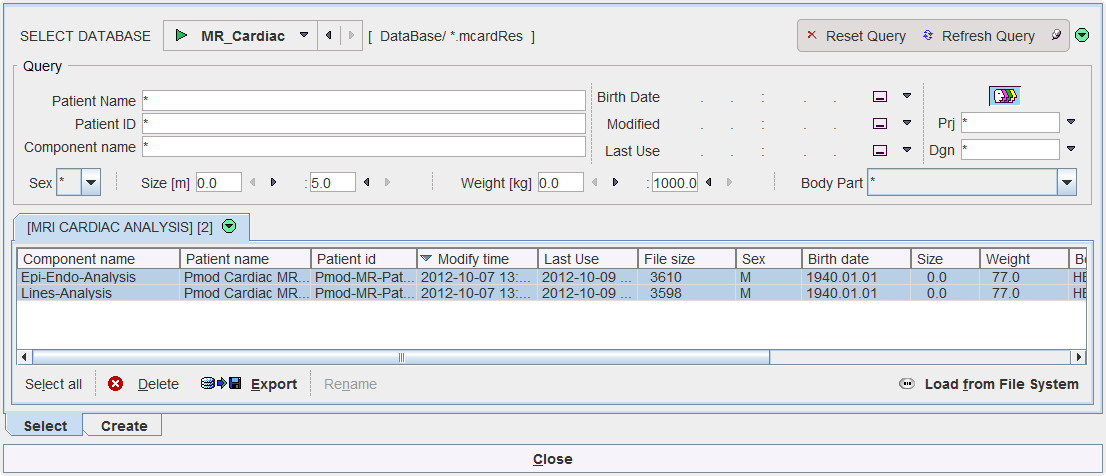
On the Select panel select the results to be aggregated, then go to the Create tab.
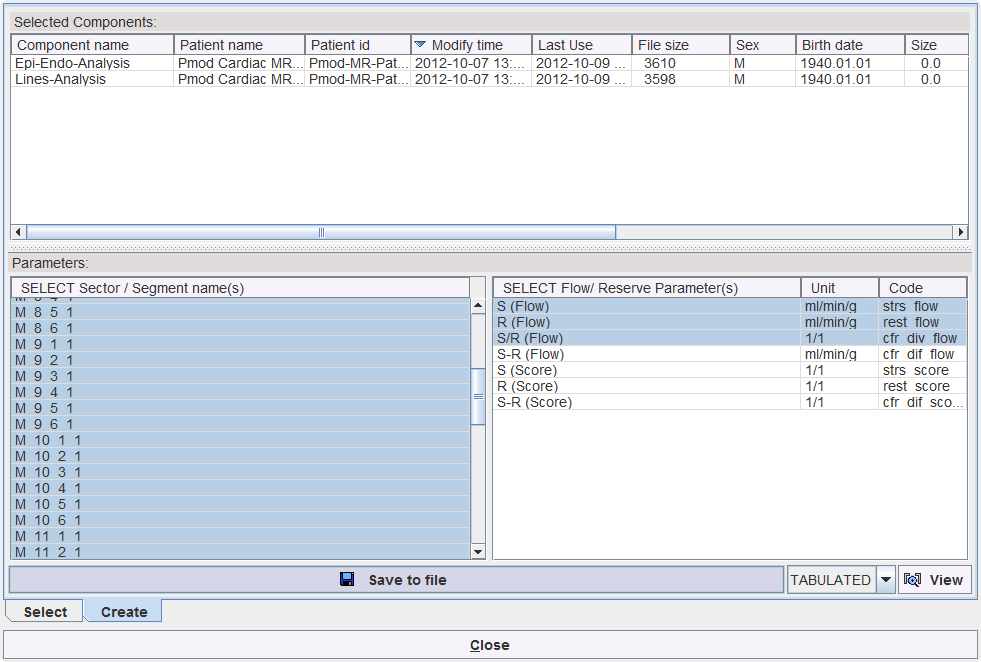
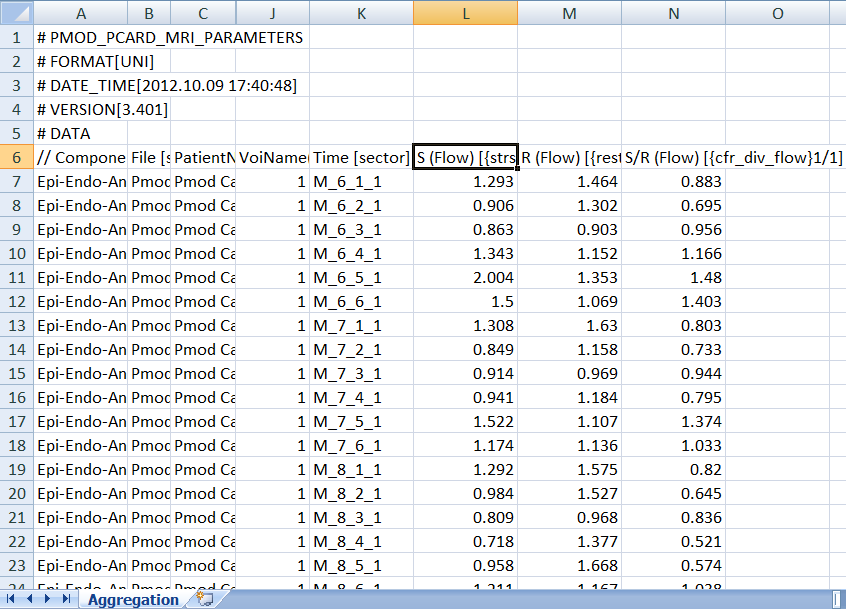
There the common segments of the selected results are shown in the left area, and the common result parameters in the right area. Select the segments to be considered, and the parameters to be listed, and then use Save to file for saving the aggregate. The example outcome is illustrated below when opened in MS Excel.
The results of aggregation can be inspected with the  button. Please refer to the PMOD Base Functionality Guide for learning about the statistics with are possible with aggregations.