![]()
![]()
![]()
![]()
|
|
|
|
|
The area on the right side of the configuration window defines the heart segmentation model applied as well as the sampling method within the segments.
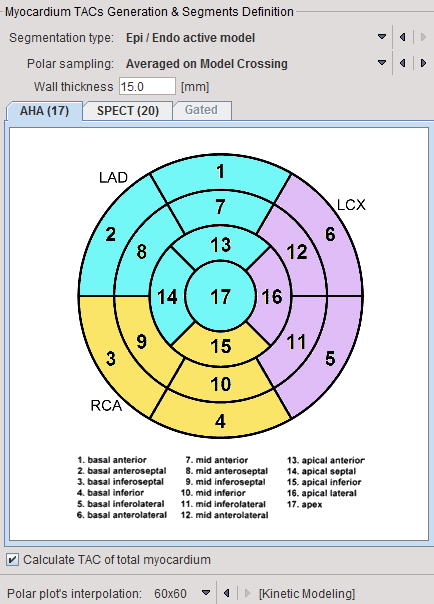
Heart Segmentation Type
PCARDP supports different segmentation models. Currently, the standard AHA 17-segment model is available, as well as the ASNC 20-segment model which is often used with SPECT data.
CAUTION: A single segmentation must be employed in order to create a normal database, and when comparing patient data against such a database.
There are two options available for the myocardium detection procedure:

Polar Sampling
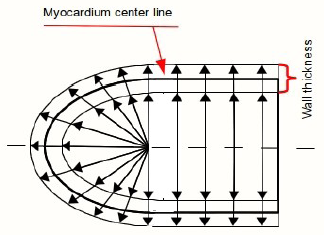
The Polar Sampling selection defines how voxels are sampled within the outlines and used for the segment TAC calculation. PCARDP interpolates the axial range defined by the myocardium model into 22 slices. For each of the base and mid slices a radial sampling is performed every 10°, and a conical sampling in the apical slices. There are different ways how the myocardium samples are detected:
METHOD |
MYOCARDIUM center line |
EPI/ENDO outline and EPI/ENDO active model |
Radial Maximum |
Using the maximum value on the radial profile. The Wall thickness determines the range from the model within which the maximum is determined.
|
The maximum value is determined along the radial profile between the Epi and Endo profiles. |
Model Crossing |
Using the value at the intersection of the radial profile with the myocardial model. |
Using the value in the middle between the Epi and Endo shapes. |
Averaged on Model Crossing |
Using a neighborhood of 4 voxels at the intersection of the radial profile with the myocardial model. |
Using a neighborhood of 4 voxels in the middle between the Endo and Epi shapes. |
Averaged on Radial Maximum |
Using a neighborhood of 4 voxels around the determined profile maximum. |
Using a neighborhood of 4 voxels around the determined profile maximum between the Endo and Epi shapes. |
The sampling locations found are not strict pixel locations, but geometrical coordinates. Correspondingly, the program will calculate the image values at the sampling points by interpolation from the neighboring pixels. Radial Maximum is recommended if there is reasonable uptake in tissue, while Model Crossing allows the user to tightly control the sampling, at the cost of having to exactly define the contours.
With the “Averaged on ..” variants more than a single sampling point is determined: the left/right and the inner/outer neighbors will also be included. The suitability of averaging is very depending on the pixel size: if the pixel size is large, the outer/inner samples might add information which is actually outside the myocardium. Therefore, averaging should only be applied with pixel sizes in the range of 2mm.
Note: the exact sampling points found by a prescribed sampling scheme can be visualized as spheres in a 3D rendering scene (see Examining the Results)
As a means to get a robust global result PCARDP allows averaging the TAC signals from all segments into a single TAC TOTAL MYOCARD. This TAC is only generated, if the box Calculate TAC of total myocardium is checked.
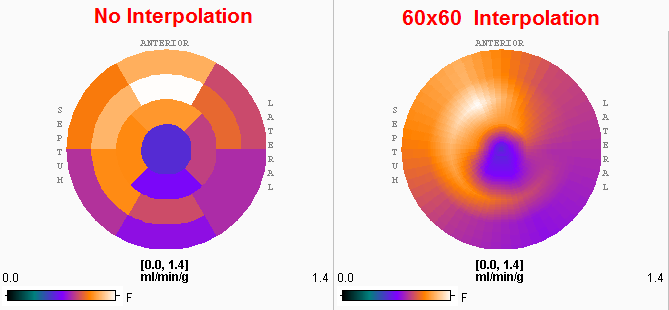
The Polar plot interpolation choice defines how the information calculated in the segments is presented in the polar plots. If it is set to NO, the segment structure is clearly visible. If set to 48x48, values at 48 radial distances and 48 angular increments are interpolated, and similarly with the 60x60 setting. The effect is illustrated in the example below. While the raw polar plot represents the true numbers, the values are smeared by the interpolation filtering.