![]()
![]()
![]()
![]()
|
|
|
|
|
The Parameters tab shows the results obtained for a processed gated study.
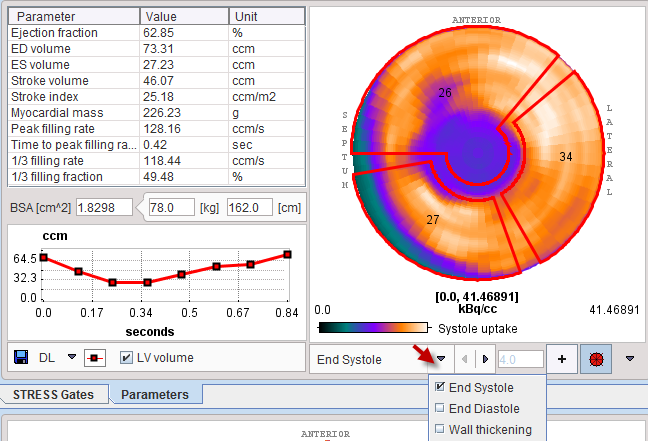
Parameter Table
The table lists the estimated functional metrics, namely
Ejection fraction (EF) |
|
End Diastolic Volume, EDV (ED volume) |
|
End Systolic Volume, ESV (ES volume) |
|
Stroke Volume (SV) |
|
Stroke Index (SI) |
NOTE: SI is provided only if the patient height and weight are available, otherwise it is NaN. Note that these fields can be edited. |
Myocardial Mass (MM) |
|
Peak Filling Rate (PFR) |
|
Time to Peak Fill Rate (TPFR) |
|
1/3 filling rate |
|
1/3 filling fraction |
|
LV Time-Volume Curve
In the plot section the volume of left ventricle is shown as a function of time in the heart cycle. To inspect the curve in a larger window, click with the right mouse button into the curve area and select View in Separate Window from the context menu. The example below shows a typical time-volume curve.
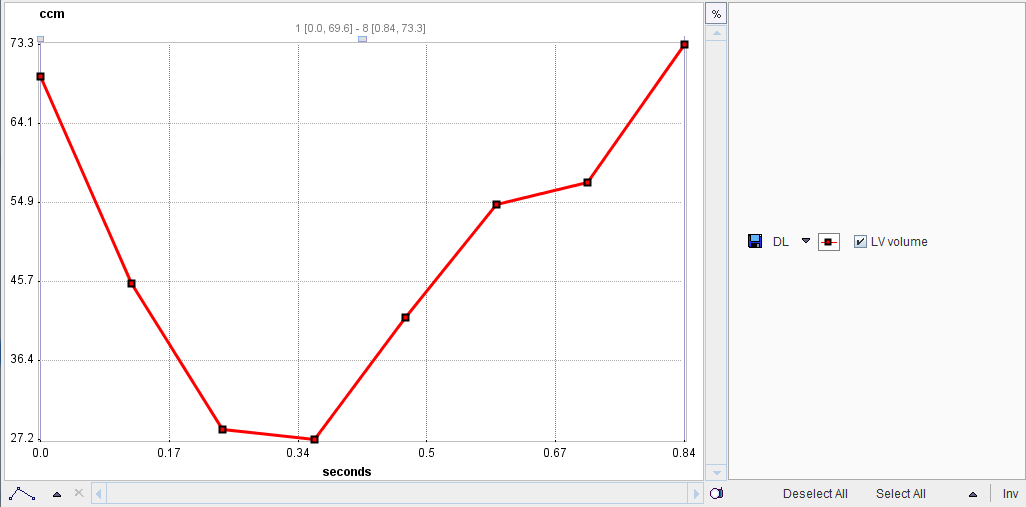
A time-volume curve is expected to have its minimum (end-systole) at gate3 or 4, and its maximum (end-diastole) at frame 1 or 8 in gated acquisitions with 8 frames. Major deviations from this behavior indicate a gating failure, and the acquisition should be repeated.
Polar Plots
The polar plots show either the tracer uptake at the End Systole or End Diastole, or the percent Wall Thickening. An overlay showing 3 vascular territories (Arterial), 4 Sectors or 20 segments (20 AHA sectors) can be selected from the pull-down menu to right of the overlay toggle ![]() .
.
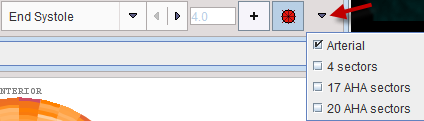
By default, Arterial definition is used. The + button allows using an explicitly defined maximum rather than the maximum in the data, which can be specified in the adjacent number field. The numbers in the polar plot overlay represent the average value in the territory or sector. When the cursor is moved about a polar plot the instantaneous value is shown in the upper right. The polar plot display control can be switched on/off by right clicking into the polar plot area and selecting the Hide/Show Controls option. After enabling the controls, the thresholds of the color table can be interactively adjusted. With the Properties entry in the context menu, display properties like Description's font size can be changed.