![]()
![]()
![]()
![]()
|
|
|
|
|
The geometry of the analysis can be visualized together with the short axis images using the button

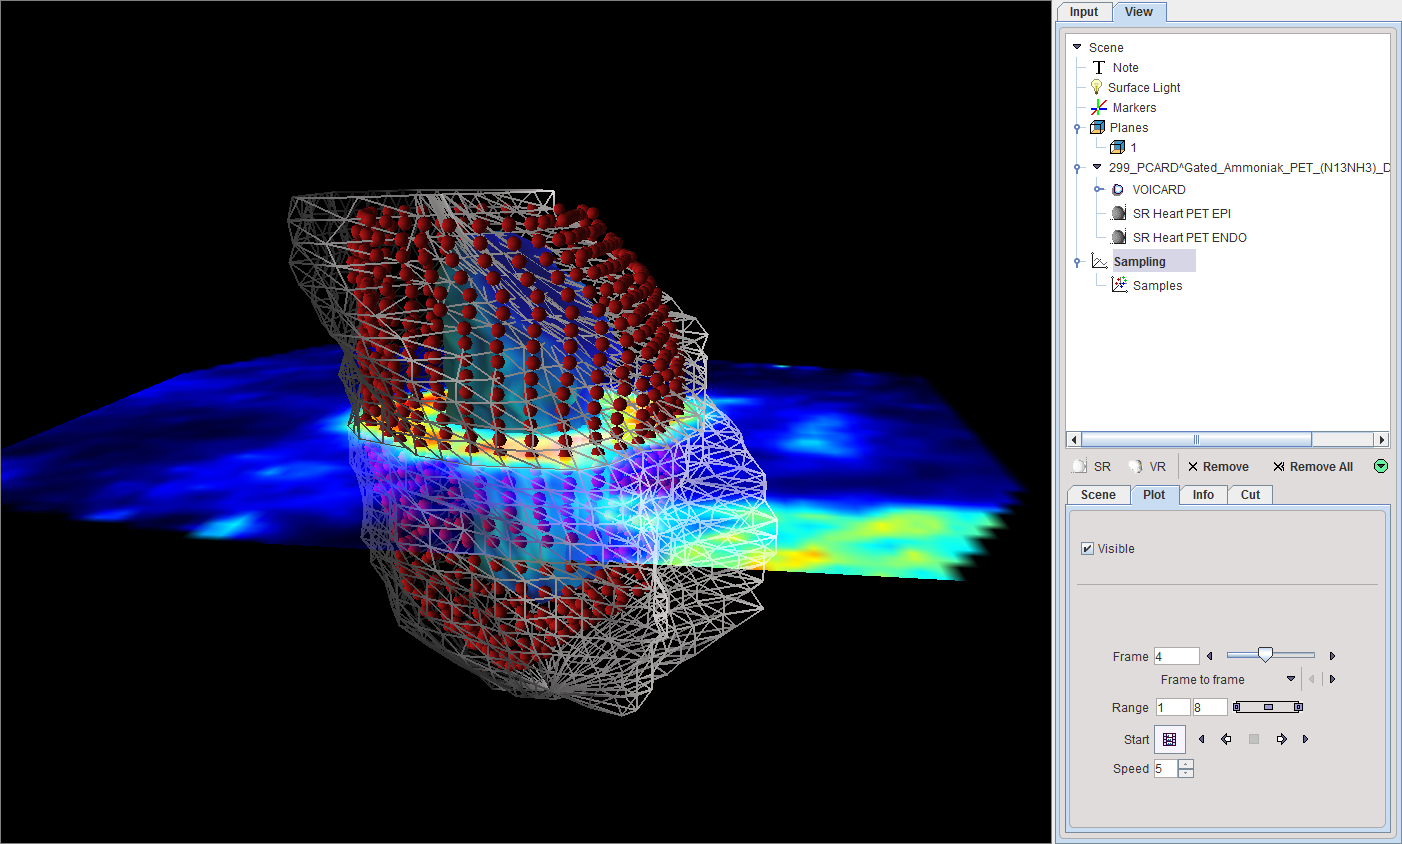
The right button calls the 3D tool which renders the shape of the myocardium model together with the sampling points. The example below shows the sampling points for the uptake as red spheres, the ENDO model as a surface, and the EPI model as a wire-frame surface. Additionally, a transparent short axis slice of the PET image is included.
To learn more about the many possibilities exploring the data in P3D please refer to the PMOD 3D Rendering User Guide.