![]()
![]()
![]()
![]()
|
|
|
|
|
The  button on the 3D page composes a report as illustrated below:
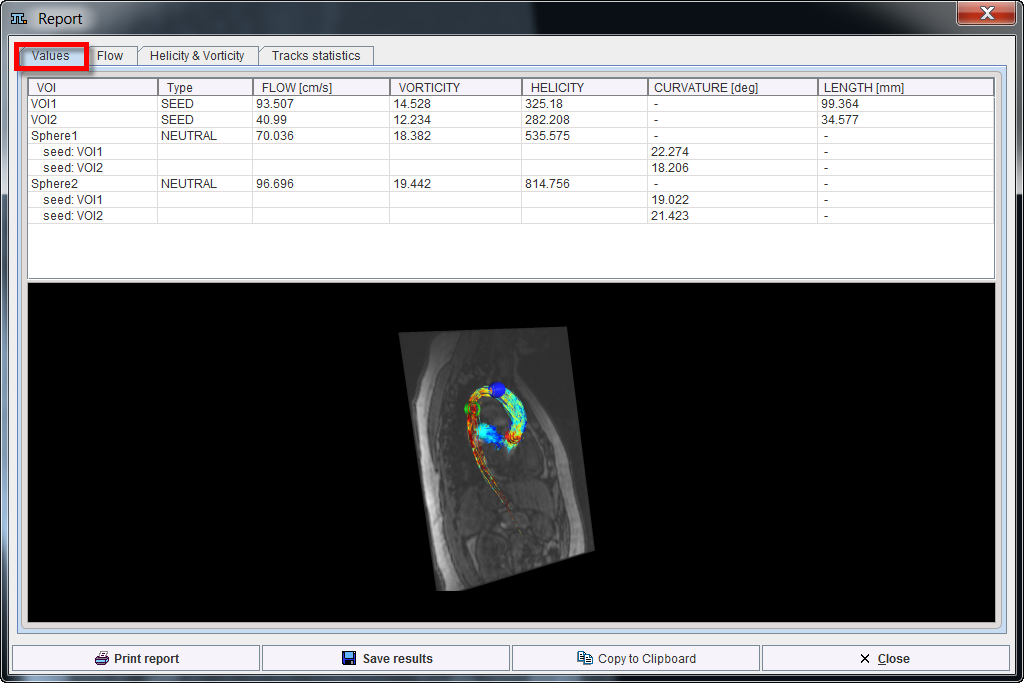
The report is organized on four pages: Values, Flow, Helicity & Vorticity, Tracks statistics
The Value page lists on the upper part the statistics of all defined VOIs. Shown is the maximum of all the VOI averages calculated along the time axis. The lower part shows a capture of the current 3D scene.
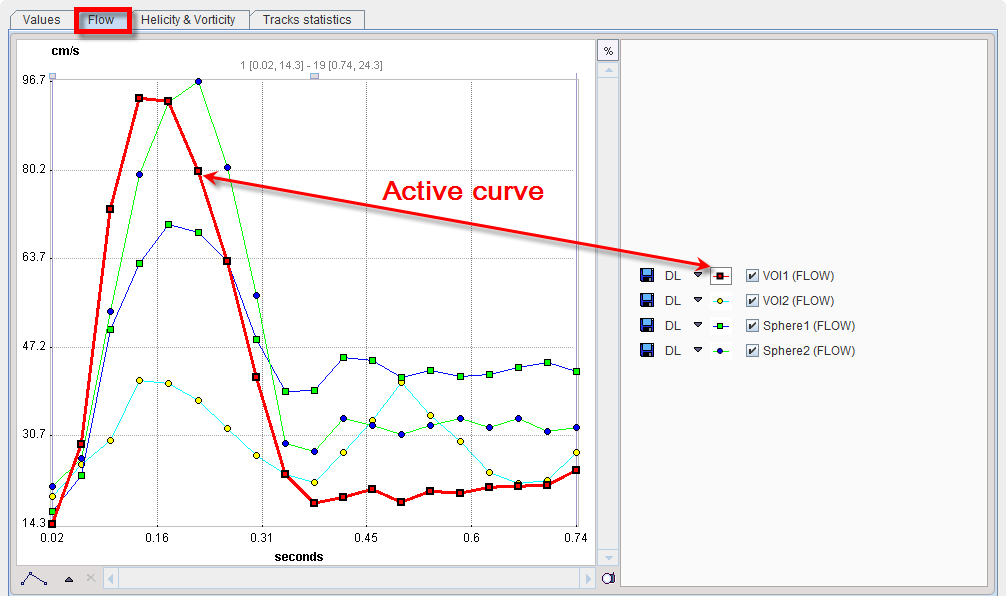
The Flow page shows the plots of the averages FLOW Velocity in all VOIs:
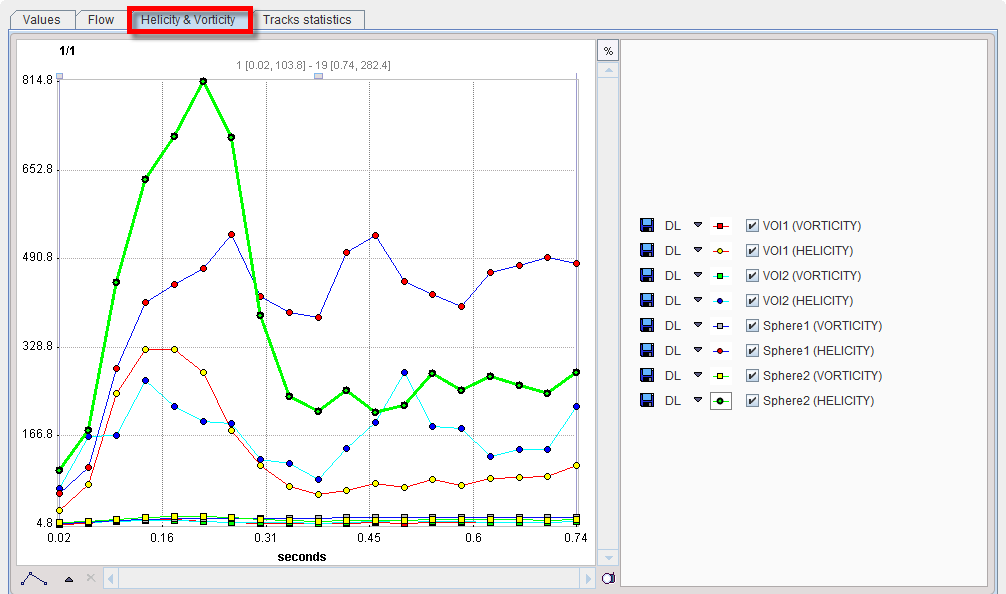
The Helicity & Vorticity page shows the plot of the average VORTICITY/HELICITY in all VOIs.
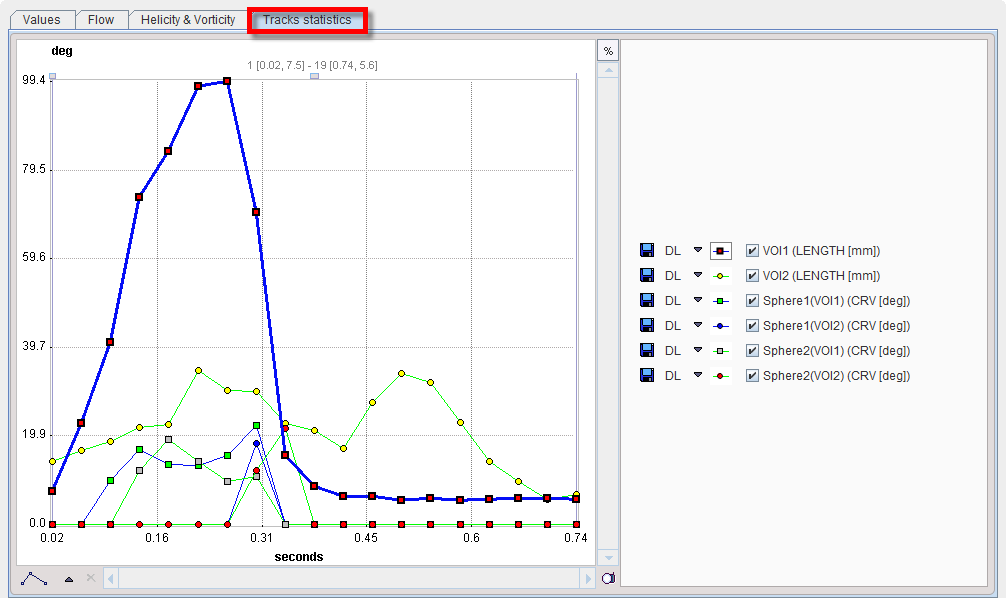
The Tracks statistics page shows the mean tracks LENGTH in all SEED VOIs along time axis. The mean curvature (CRV[dgr]) is calculated and displayed for each Neutral VOI at each time point:
As usually, the report can be printed or captured in various formats via Print report. Save results serves for saving the numeric values, which can also be exported via Copy to Clipboard.