![]()
![]()
![]()
![]()
|
|
|
|
|
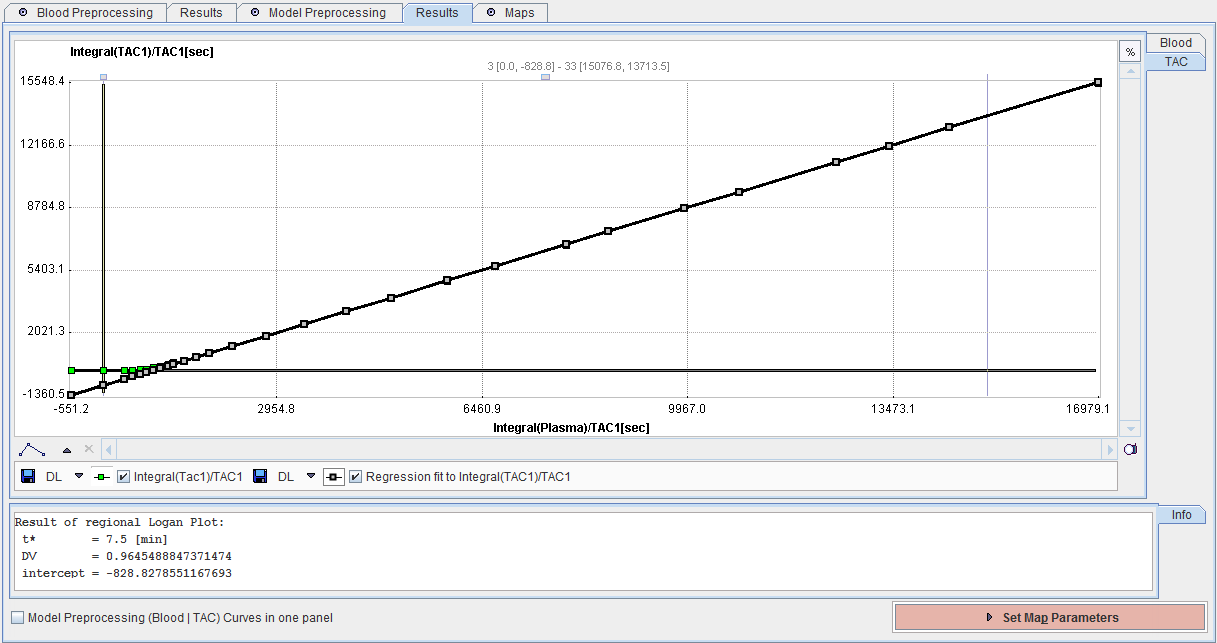
The Results tab shows the outcome of the model preprocessing. Again, the information shown is highly model-dependent, and in some cases will be missing. The example below shows the result of fitting t* for the Logan plot with an error criterion of 10%. The Logan plot with the regression line is shown in the TAC curve panel, whereas the numeric output can be found in the Info area. The Blood data can also be inspected using the corresponding tab.
How To Continue
The purpose of this tab is to provide information for the user to decide whether the preprocessing was successfully. If this is the not the case, please select the Model Preprocessing tab and adjust the configuration. Otherwise proceed to the configuration of the desired parametric maps with the Set Map Parameters button.