![]()
![]()
![]()
![]()
|
|
|
|
|
The MBF NH3 (BFM) model implements the pixelwise fitting of a cardiac model for dynamic ammonia PET scans. The model was derived from the parametric mapping method developed by Harms et al [1] for water scans.
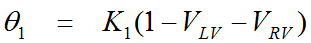
The operational equation for cardiac PET includes two geometric spillover fractions (Vlv, Vrv) from left ventricular and right ventricular blood (Clv, Crv):
![]()
The tracer concentration in myocardium Cmyo(t) is modeled by a one-tissue compartment model and can be obtained by the convolution of the metabolite-corrected input curve with a decaying exponential, multiplied by K1:

For the ammonia tracer K1 corresponds to mycocardial blood flow (MBF), and k2 to the tissue washout. The linear metabolite correction with slope -mCorr which is applied in this equation was derived by de Grado et al [2] and is only valid for scan durations up to 4 minutes.
The solution of the operational equation uses basis functions of the form
![]()
With the basis functions, the operational equation can be reformulated as a multi-linear equation
![]()
with
The data analysis methodology then consists of the following two steps:
Note: The same model is also applied for the MBF parametric mapping ina the cardiac PET tool PCARDP
Data Requirements
Image Data |
A cardiac PET data set using the ammonia tracer and acquired for 4 minutes. If the acquisition was longer, only the first 4 minutes should be loaded. |
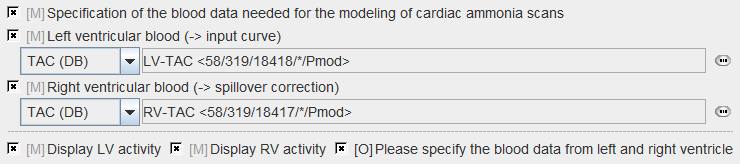
Blood Data |
The TAC of blood in the left ventricle and right ventricles is required. Both TACs are applied for a geometrical spillover correction. The LV TAC is also metabolite-corrected and used as the input curve for the 1-tissue compartment model of ammonia. |
Data Loading
It is recommended to reorient the images into short-axis (SA) orientation for the processing. This operation can be performed outside of PXMOD. An alternative is to try the PET Heart Reorientation during data loading by the configuration illustrated below. Essentially, the early and the late phases are averaged and an automatic procedure tries finding the SA orientation. For details please refer to the guide of the cardiac PET tool PCARDP which explains the background in more detail.
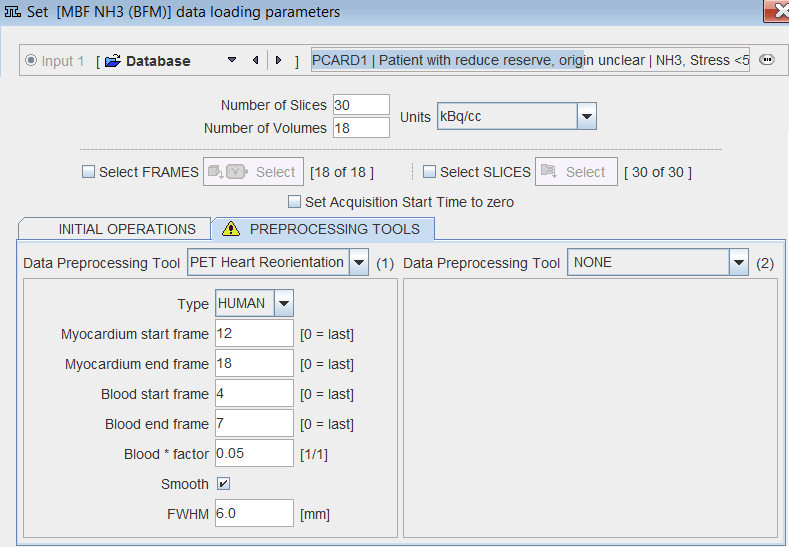
The example below illustrates a successful reorientation result. If it fails, it is recommended to try optimizing the frame ranges used for averaging.

Masking
It is recommended generating a mask which restricts parametric mapping to the myocardium. This can easily be achieved by a threshold segmentation of the averaged late frames.

TACs
In SA orientation the definition of VOIs should be relatively easy. In the example below a regular sphere was placed in the LV, scaled and slightly rotated. The RV VOI was created using the paintbrush, and the Myocardial VOI using the >3D region growing.

In order to be independent of the image orientation it is recommended to save the actual curves rather than the VOI definition by the  button ton the TACs panel.
Blood Preprocessing
By the saving of the TACs from the TACs panel the references to the curves are directly stored to the Blood Preprocessing panel.
Model Preprocessing
During model preprocessing the basis functions are calculated for the prescribed range of k2. The default range is a1 Î[0.01,2]min-1. Using these basis functions, the myocardial TAC is then fitted.
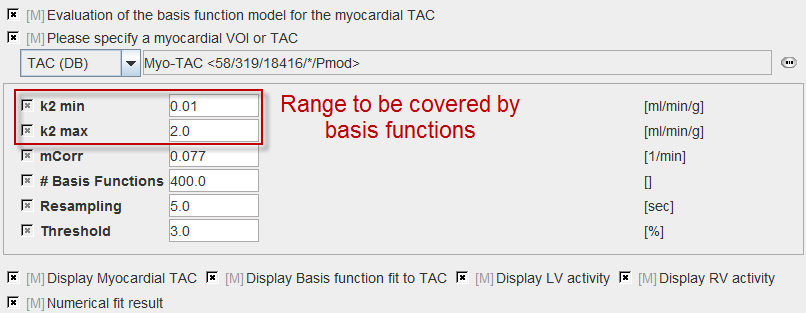
k2 min |
Define the k2 range covered by the basis functions. |
mCorr |
Slope of the linear metabolite correction which is applicable for 4 minutes. |
#Basis |
Number of intermediate k2 values generated between k2 min and k2 max. The increments are logarithmically spaced. |
Resampling |
Sampling increment applied during the basis function calculation. |
Threshold |
Discrimination threshold for background masking. All pixels with energy below Threshold[%] of the maximal energy will be masked to zero. |
Model Configuration
The example below shows the default configuration.

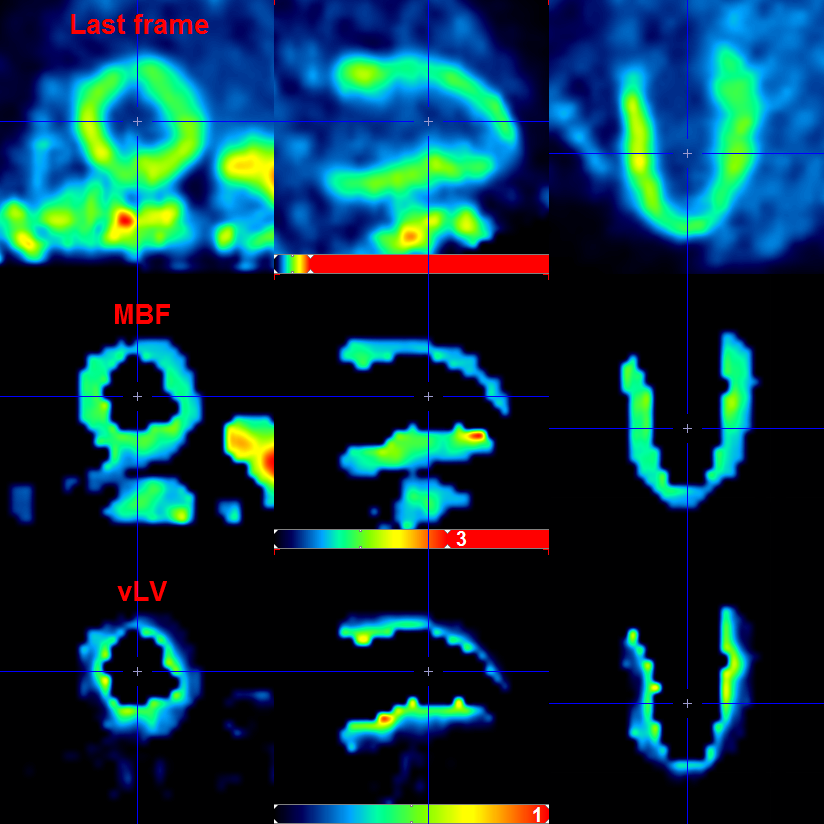
MBF |
Myocardial blood flow, equal to K1 in the 1-tissue compartment model. |
k2 |
The k2 value which basis function provided the best fit of the data. |
vLV |
Fraction of blood spillover from the left ventricle. |
vRV |
Fraction of blood spillover from the right ventricle. |
Example
The example below shows the parametric map of the rest scan with a normal volunteer.
References
1. Harms HJ, Knaapen P, de Haan S, Halbmeijer R, Lammertsma AA, Lubberink M: Automatic generation of absolute myocardial blood flow images using [15O]H2O and a clinical PET/CT scanner. Eur J Nucl Med Mol Imaging 2011, 38(5):930-939.
2. DeGrado TR, Hanson MW, Turkington TG, Delong DM, Brezinski DA, Vallee JP, Hedlund LW, Zhang J, Cobb F, Sullivan MJ et al: Estimation of myocardial blood flow for longitudinal studies with 13N-labeled ammonia and positron emission tomography. J Nucl Cardiol 1996, 3(6 Pt 1):494-507.