![]()
![]()
![]()
![]()
|
|
|
|
|
Logan et al. [1] developed a reference tissue method for reversible receptor ligands which does not depend on a specific model structure of the reference tissue. Assuming the presence of reference region TAC CT'(t) with an average tissue-to-plasma clearance k2', the target tissue TAC CT(t) is transformed and plotted as a function of the transformed reference TAC, as illustrated below.
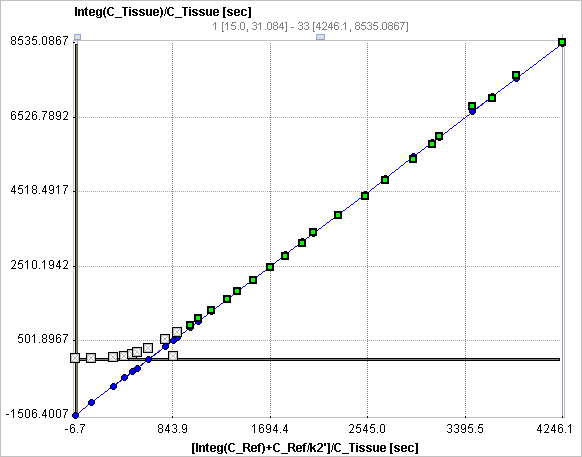
The operational equation resembles a linear equation with the distribution volume ratio (DVR = BPND+1) as the slope plus an error term which decreases over time. Therefore the late part starting from a time t* of the plotted samples can be fitted by a regression line and the slope used for calculating BPND. The time t* can be determined as the time after which no further significant increases in slope are observed.
The graphical plot of the Logan Reference Tissue method is described by the following equation with the form resembling a linear equation.
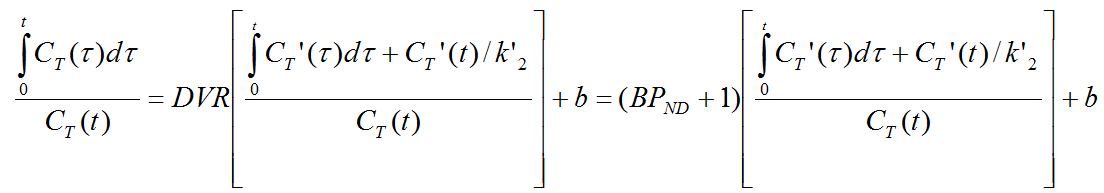
k2' in the original publication was the population average k2 determined for the reference tissue using blood sampling, but using the subject's own k2' may be preferable.
Acquisition and Data Requirements
Image Data |
A dynamic data set acquired long enough that the equilibrium relation is approximately fulfilled. |
TAC 1 |
TAC from a receptor-rich region (such as basal ganglia for D2 receptors). |
TAC 2 |
TAC from a receptor-devoid region (such as cerebellum or frontal cortex for D2 receptors). |
k2' |
A average value of the efflux rate constant from regions without receptors, which has been previously determined. |
Model Preprocessing
Two regional TACs (TAC1 and TAC2) are needed for Model Preprocessing.
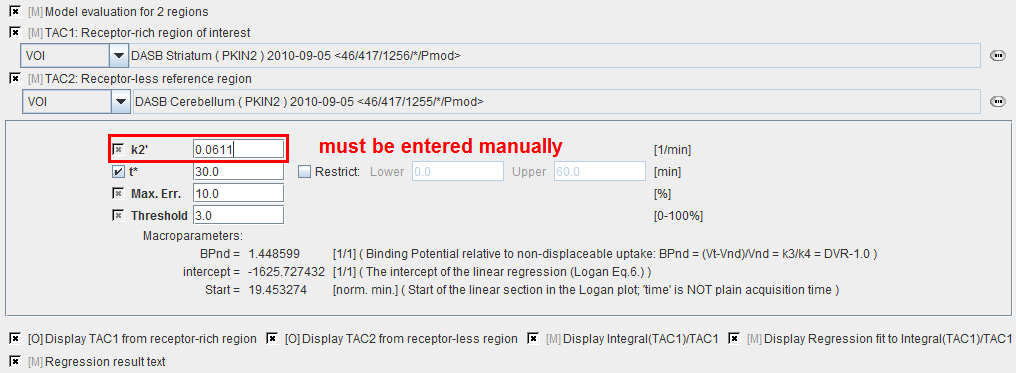
k2' |
The average value of the efflux constant k2. It must have been determined separately and is only an input parameter to be manually entered. Note that the value of k2' also has an impact on fitting t*. |
t* |
The linear regression estimation should be restricted to a range after an equilibration time. t* marks the beginning of the range used in the linear regression analysis. It can be fitted based on the Max. Err. criterion. Note: Time is in acquisition time, not in the normalized time of the graphical plot. |
Max. Err. |
Maximum relative error allowed between the linear regression and the Logan-transformed measurements in the segment starting from t*. |
Threshold |
Discrimination threshold for background masking. |
BPnd |
Binding potential, calculated by as: BPnd = k3/k4 = DVR-1.0 |
intercept |
The intercept of the linear regression (Logan Eq.6.) |
Start |
Time in the plot which corresponds to t*. |
The result of the fit during Model Preprocessing is shown in the Result panel for inspection.
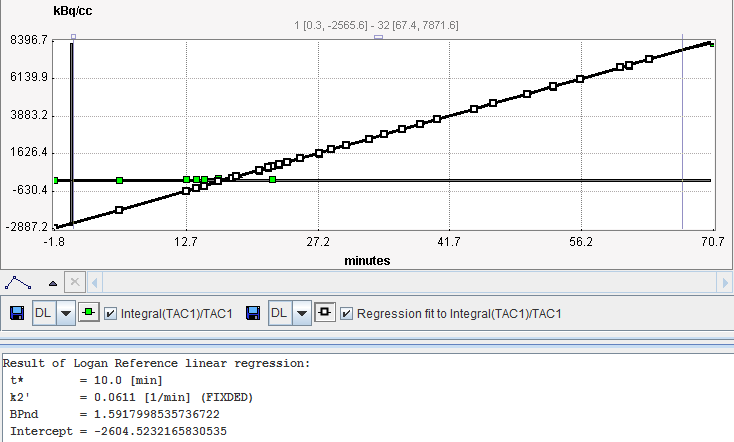
Model Configuration
BPnd |
Binding potential, calculated by as: BPnd = k3/k4 = DVR-1.0 where DVR is the slope of the fitted regression line. |
intercept |
Intercept of the linear regression (Logan Eq.6.) |
Reference
1. Logan J, Fowler JS, Volkow ND, Wang GJ, Ding YS, Alexoff DL: Distribution volume ratios without blood sampling from graphical analysis of PET data. J Cereb Blood Flow Metab 1996, 16(5):834-840. DOI