![]()
![]()
![]()
![]()
|
|
|
|
|
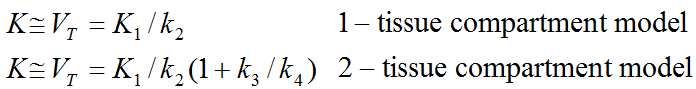
The Logan plot has been developed by Logan et al. [1] for ligands that bind reversibly to receptors and enzymes and is used for estimating the total distribution volume VT. Its results can be interpreted with respect to the 1- and 2-tissue compartment models.

The Logan plot belongs to a group of Graphical Analysis techniques, whereby the measured tissue TAC CT(T) undergoes a mathematical transformation and is plotted against some sort of "normalized time". The Logan plot is given by the expression
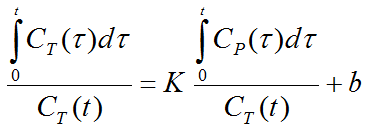
with the input curve Cp(t). This means that the tissue activity integrated from the time of injection is divided by the instantaneous tissue activity, and plotted at a "normalized time" (integral of the input curve from the injection time divided by the instantaneous tissue activity). For systems with reversible compartments this plot will result in a straight line after an equilibration time t*.
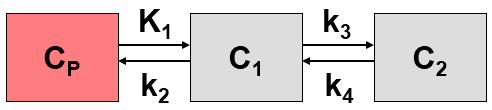
In the derivation of the Logan plot the PET signal is described as a sum of tissue activity plus a fractional plasma signal
![]()
unlike the operational equation of the compartment model. Under these premises the slope represents the total distribution volume VT plus the plasma space vP in the VOI, which is usually neglected. Therefore
Acquisition and Data Requirements
Image Data |
A dynamic PET data set. |
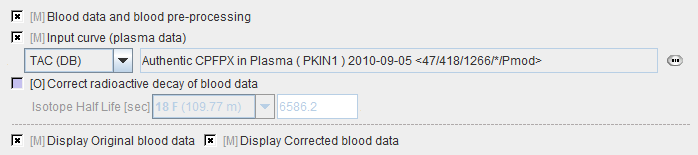
Blood Data |
Blood activity sampled at a peripheral artery from the time of injection until the end of the acquisition. |
Tissue TAC |
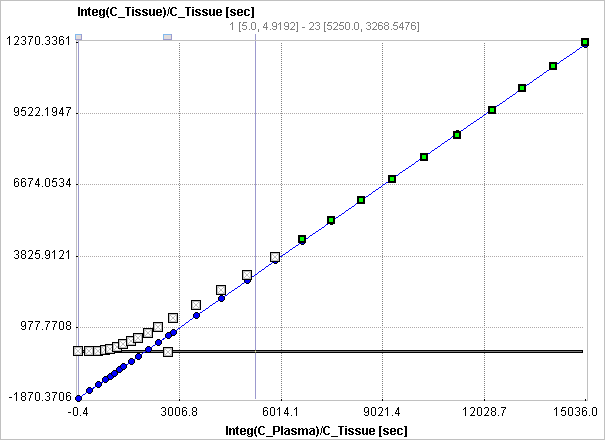
A regional time-activity curve from a representative brain region. It is presented as a Logan plot and can be used to define the linear segment where regression analysis should be done. |
Blood Preprocessing
Decay correction is the only blood correction option.
Model Preprocessing
The Logan graphical plot is performed with the TAC from a tissue VOI (TAC1) and presented to the user. In this plot, the TAC should become linear after an equilibration time. The slope of the linear segment equals the total distribution volume. The user must decide on the beginning of the linear segment and specify this time in the model configuration. An alternative is to apply an automatic criterion for determining this start time.
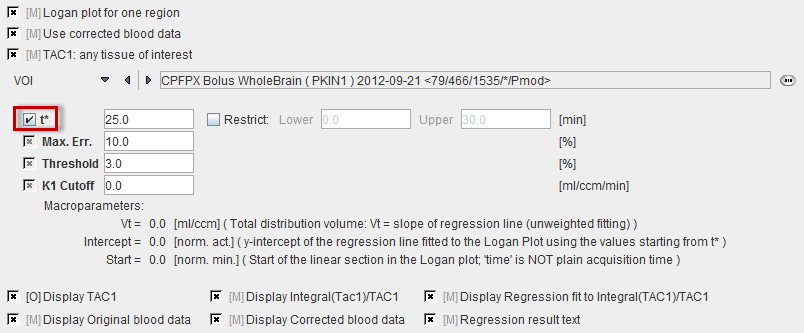
t* |
The linear regression estimation should be restricted to a range after an equilibration time. t* marks the beginning of the range used in the multi-linear regression analysis. It can be fitted based on the Max. Err. criterion. Note that the t* is in acquisition time. |
Max. Err. |
Maximum relative error ( (measured-predicted)/predicted ) allowed between the linear regression and the Logan-transformed measurements in the segment starting from t*. |
Threshold |
Discrimination threshold for background masking. |
Vt |
Distribution volume = slope of the linear regression to the Logan plot. |
Intersect |
Intercept of the linear regression line. |
Start |
Time corresponding to t* in the Logan plot. |
The Logan plot is shown in the preprocessing Result. The user should consult this plot in order to check whether the Start time is adequate.
Model Configuration
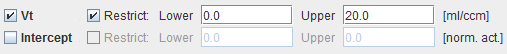
Vt |
Distribution volume = slope of the linear regression to Logan plot from t*. |
Intersect |
Intercept of the linear regression. |
Reference
1. Logan J, Fowler JS, Volkow ND, Wolf AP, Dewey SL, Schlyer DJ, MacGregor RR, Hitzemann R, Bendriem B, Gatley SJ et al: Graphical analysis of reversible radioligand binding from time-activity measurements applied to [N-11C-methyl]-(-)-cocaine PET studies in human subjects. J Cereb Blood Flow Metab 1990, 10(5):740-747. DOI