![]()
![]()
![]()
![]()
|
|
|
|
|
The MRGlu (FDG Patlak, Slice-dependent Times) model is intended for the quantitative assessment of the regional metabolic rate of glucose (MRGlu) with FDG. The required measurements are a dynamic PET scan after the injection of a FDG bolus and a measurement of the FDG activity in blood. The analysis is done using the Patlak graphical plot method [1] which has been developed for systems with irreversible trapping, ie. k4=0 in a 2-tissue compartment model.
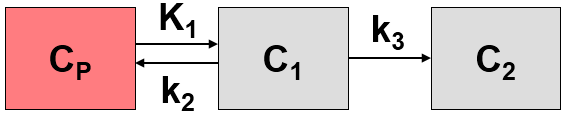
However, this model structure is not necessary for the application of the method. It is sufficient to have any compartment in the system which binds irreversibly.
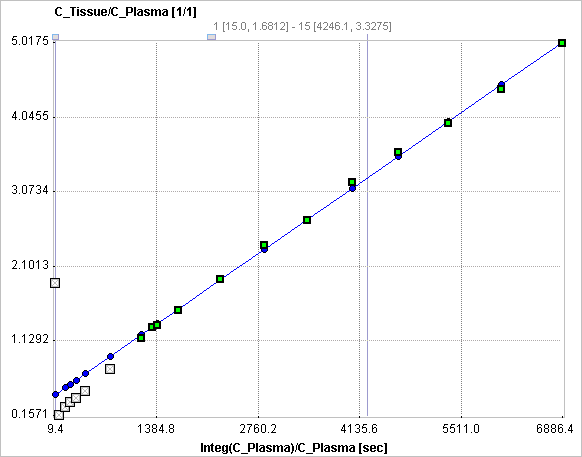
The Patlak plot belongs to a group of Graphical Analysis techniques, whereby the measured tissue TAC CT(T) undergoes a mathematical transformation and is plotted against some sort of "normalized time". The Patlak plot is given by the expression
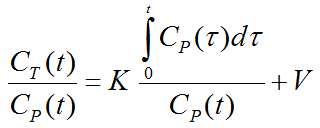
with the input curve Cp(t). This means that the measured PET activity is divided by plasma activity, and plotted at a "normalized time" (integral of the input curve from the injection time divided by the instantaneous plasma activity). For systems with irreversible compartments this plot will result in a straight line after an equilibration time t*, which is dependent on the tissue properties and may range between 20 and 60 minutes.
The slope and the intercept must be interpreted according to the underlying compartment model. For the FDG tracer, the slope Ki equals K1k3/(k2+k3) and represents the metabolic influx, while the intercept equals V1+vB with the distribution volume V1 of FDG in tissue and the fractional blood volume vB.
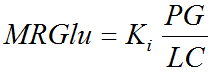
For the analysis of FDG data, a Lumped Constant (LC) and the Plasma glucose level (PG) of the patient need to be entered. The metabolic rate of glucose MRGlu is then obtained from the regression slope Ki by
Acquisition and Data Requirements
Image Data |
A dynamic PET data set representing the measurements covering a sufficient time range after injecting a 18F-Deoxy-Glucose (FDG) bolus. If the scanner FOV was not at a fixed location during the scan, the slice-times need to be contained in the image attributes. The model has been tested with the data of Siemens equipment (DICOM Conformance statement, see Frame Reference Time). |
Blood Data |
Blood activity from the time of injection until the end of the scan. It is important, that the blood and the image data have the same time base and decay correction is relative to the same time. |
Blood Preprocessing
The only necessary configuration is specification of the blood activity curve, either as a file, or as a VOI placed over a vessel such as the descending aorta or the left ventricle. Note, however, that the blood information must be available from the time of injection, whereas later measurements are sufficient for the tissue.

Note: A single exponential function is fitted to the blood data from 25 minutes. This approach is reasonable for FDG data and reduces noise in the Patlak estimation.
Model Preprocessing
The model processing panel includes two classes of options.
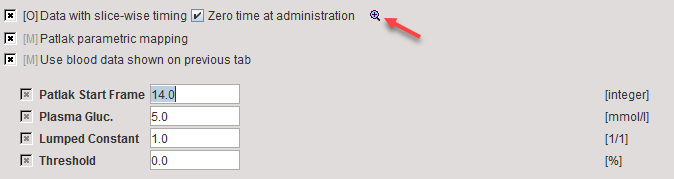
The check boxes at the top are related to the data:
Data with slice-wise timing |
Enabling the check instructs PXMOD to extract a dedicated time for each slice. |
Zero time at administration |
The slice reference times are relative to the time when the acquisition was started. If there is a delay between the tracer injection and scan start, this offset has to be added to the slice reference times. This operation is enabled by checking the box. Note, that if available an appropriated time is extracted from the Radiopharmaceutical Start DateTime (0018,1078) information. For GE data, the private field (0009,103B) is used. |
The indicated  button opens a dialog window for inspecting the times of the slices during the acquisitions.
The parameters of the actual Patlak plot are:
Patlak Start Frame |
Specification of t* in real acquisition time is not appropriate, because the times are slice-dependent. Therefore, the frame number is specified from which on the data in the Patlak plot is used for linear regression. |
Plasma Gluc. |
Plasma glucose in [mmol/l] measured with a blood sample of the patient. |
Lumped Constant |
The Lumped Constant is used to compensate for the difference in uptake between normal glucose and Fluoro-Deoxyglucose (FDG). It differs between tissues and therefore is set to 1 by default. |
Threshold |
Discrimination threshold for background masking. |
Model Configuration
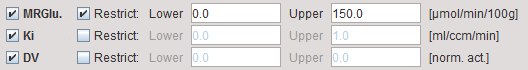
MRGlu |
Metabolic Rate of Glucose in [mmol/min/100ml], the actual result of the model. It is calculated as: |
Ki |
Slope of the linear regression. It equals the influx Ki=(K1*k3)/(k2+k3) of the 2-tissue compartment model and is directly proportional to MRGlu. |
DV |
Distribution volume of FDG in tissue plus blood fraction (= intercept of the linear regression). |
Reference:
1. Patlak CS, Blasberg RG, Fenstermacher JD: Graphical evaluation of blood-to-brain transfer constants from multiple-time uptake data. J Cereb Blood Flow Metab 1983, 3(1):1-7. DOI