![]()
![]()
![]()
![]()
|
|
|
|
|
The Patlak plot has been developed by Patlak and Blasberg [1] for tracers undergoing irreversible trapping. Most often it is applied for the analysis of FDG, which can be modeled as a 2-tissue compartment model with k4=0.
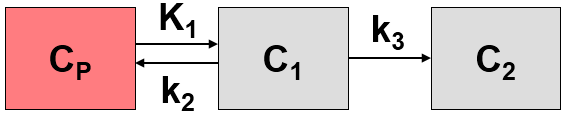
However, this model structure is not necessary for the application of the method. It is sufficient to have any compartment in the system which binds irreversibly.
When the plasma activity is not available, the Patlak plot can be employed as a reference method provided that there exists some tissue wherein tracer is not irreversibly trapped. The procedure simply replaces the input curve by the reference tissue TAC.
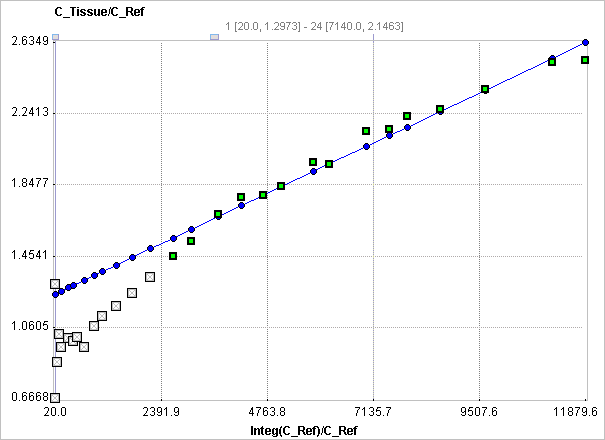
The Patlak plot belongs to a group of Graphical Analysis techniques, whereby the measured tissue TAC CT(T) undergoes a mathematical transformation and is plotted against some sort of "normalized time". The Patlak plot using reference tissue is given by the expression

with the reference tissue TAC CT'(t). This means that the measured PET activity is divided by the reference tissue activity, and plotted at a "normalized time" (integral of the reference TAC from the injection time divided by the instantaneous reference activity). For systems with irreversible compartments this plot will result in a straight line after an equilibration time t*.
Under several assumptions, including a common K1/k2, the slope of the linear regression represents the following relation
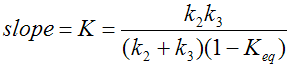
with the equilibrium constant Keq.
The reference Patlak plot has been applied for the FDOPA PET tracer for calculating an index of the influx Ki.. Both the cerebellum and the occipital lobe have been used as the reference [2].
Acquisition and Data Requirements
Image Data |
A dynamic PET data set with an appropriate tracer. |
TAC 1 |
TAC from a region with irreversible binding (such as caudate for FDOPA). |
TAC 2 |
TAC from a region without irreversible binding (such as occipital or cerebellum for FDOPA). |
Model Preprocessing
Two regional TACs (TAC1 and TAC2) are needed for Model Preprocessing.
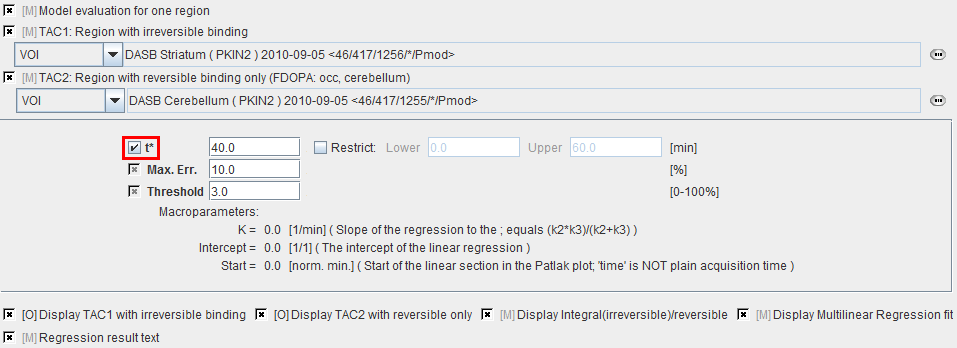
t* |
The linear regression estimation should be restricted to a range after an equilibration time. t* marks the beginning of the range used in the multi-linear regression analysis. It can be fitted based on the Max. Err. criterion. Note that the t* is in acquisition time. |
Max. Err. |
Maximum relative error allowed between the linear regression and the Patlak-transformed measurements in the segment starting from t*. |
Threshold |
Discrimination threshold for background masking. |
K |
Slope of the linear regression. K=(k2*k3)/(k2+k3). |
Intercept |
Intercept of the linear regression. |
Start |
Time in the plot which corresponds to t*. |
Model Configuration
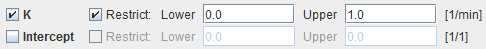
K |
Slope of the linear regression. K=(k2*k3)/(k2+k3). |
Intercept |
Intercept of the linear regression. |
References:
[1] Patlak CS, Blasberg RG: Graphical evaluation of blood-to-brain transfer constants from multiple-time uptake data. Generalizations. J Cereb Blood Flow Metab 1985, 5(4):584-590. DOI
[2] Sossi V, Holden JE, de la Fuente-Fernandez R, Ruth TJ, Stoessl AJ: Effect of dopamine loss and the metabolite 3-O-methyl-[18F]fluoro-dopa on the relation between the 18F-fluorodopa tissue input uptake rate constant Kocc and the [18F]fluorodopa plasma input uptake rate constant Ki. J Cereb Blood Flow Metab 2003, 23(3):301-309. DOI