![]()
![]()
![]()
![]()
|
|
|
|
|
The Spectral Analysis SAIF model allows performing a Spectral Analysis (SA) with an explicit trapping compartment [1].
Operational Model Curve of Spectral Analysis
The operational equation for this type of SA is given by
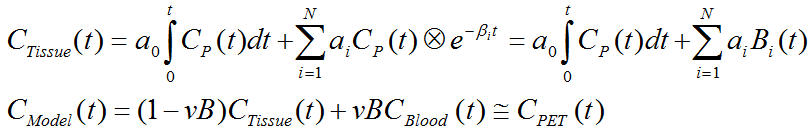
that is, tissue uptake is modeled as a sum of N possible tissue responses plus a flux a0 into the irreversible compartment. Like for the compartment models a fixed blood volume fraction vB is supported.
Due to the constraint of first order tracer kinetics, the coefficients ai and the decay constants bi must be non-negative. In practice, a discrete set of the decay constants bi is selected which covers the physiologically reasonable range, typically logarithmically spaced in the range [10-5,1]sec-1. The corresponding tissue responses
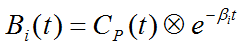
are the Basis Functions of spectral analysis. When fitting the operational equation above to a tissue TAC, the only unknowns are the coefficients ai, because only a pre-defined set of discrete bi values is considered. Therefore, the problem is that of a non-negative linear least squares estimation (NNLS) with the constraint of non-negative coefficients.
An advantage of SA is the fact that no particular compartment structure is imposed. Rather, its result can be used to estimate how many kinetic tissue compartments can be resolved by PET. To this end, the results are plotted as a spectrum with the selected decay constants bi along the x-axis (as the "frequencies") and the estimated coefficients ai along the y-axis (as the "amplitudes"). Because of the large range, log(bi) is used in spectrum plotting rather than bi. The number of peaks in this spectrum corresponds to the number of distinct compartments. A peak appearing to the far left (low frequency, slow component) indicates irreversible trapping. A peak to the far right (high frequency, fast component) corresponds to kinetics indistinguishable from the input curve, thus to vascular contributions. Intermediate peaks represent compartments which exchange reversibly with plasma or with other tissue compartments.
The Spectral Analysis with Iterative Filter (SAIF) approach uses a bandpass filter for selecting the real equilibrating compartments. The passband is defined by a range [bL , bH]. It is assumed that all bi < bL are shifted noise components, and all bi > bH shifted blood components. In an iterative process the following two steps are repeated
The iteration is repeated until the residuals from step 1 and 2 are very similar.
Acquisition and Data Requirements
Image Data |
A dynamic PET data set using a tracer with irreversible trapping. |
Blood Data |
The plasma activity from the time of injection until the end of the acquisition. Optionally: whole blood activity to be subtracted from the pixel-wise TACs, loaded as Whole Blood Data in Blood Preprocessing. |
TAC1 |
A time-activity curve (or VOI) of representative tissue used to determine the starting parameters and the K1/k2 ratio. |
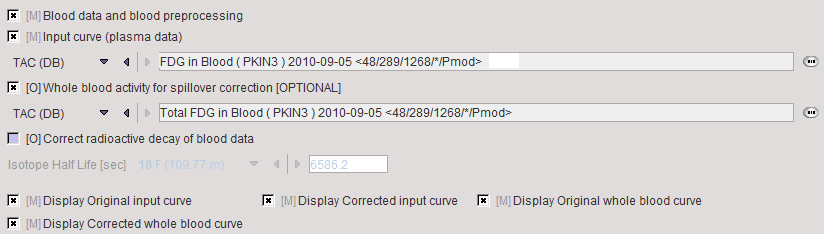
Blood Preprocessing
It is assumed that no Preprocessing other than an optional decay correction must be applied to the plasma activity. This blood data serves as the input curve of the 2-tissue compartment model.
Model Preprocessing
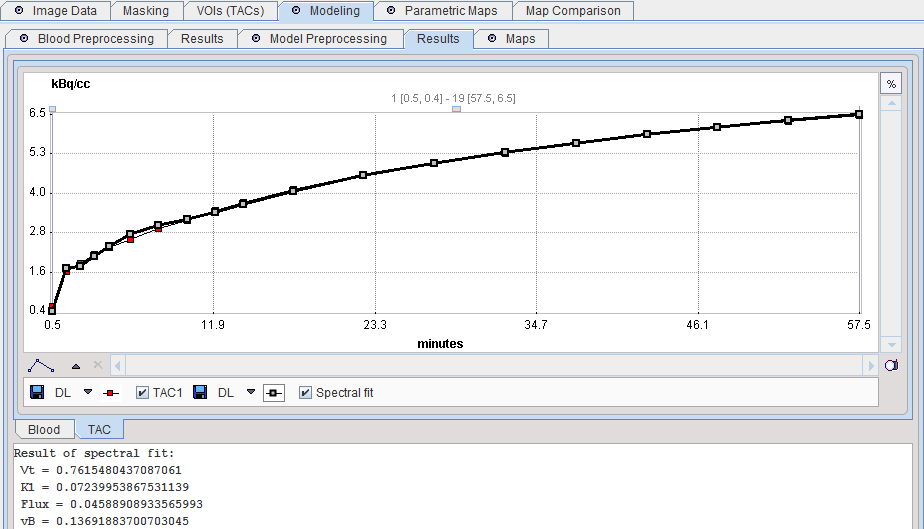
The Model Preprocessing panel specifies a tissue time-activity curve (TAC1, FILE or VOI) and the parameters for the spectral analysis. The model is fitted to the TAC during preprocessing and the values updated accordingly.
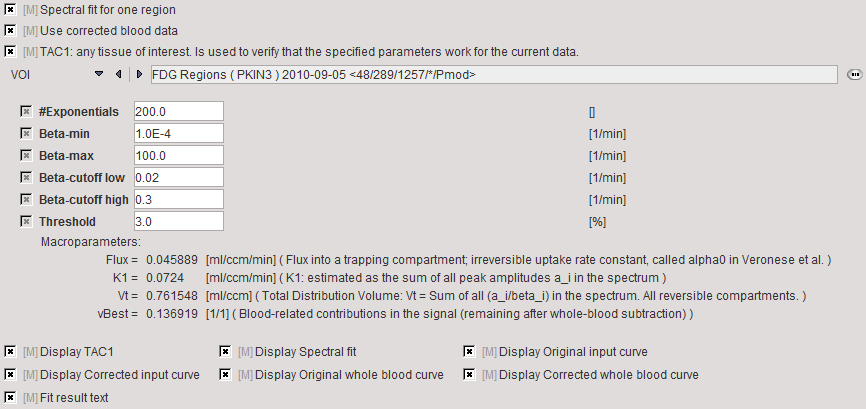
#Exponentials, |
Number of discrete bi decay constants which are logarithmically spaced in the range between Beta-min and the Beta-max |
Beta-min, Beta-max |
The passband of equilibrating compartments is defined by Beta-cutoff low (bL) and Beta-cutoff high (bH) |
Threshold |
Discrimination threshold for background masking. |
The resulting fit is shown in the preprocessing Result for inspection.
Model Configuration
The Maps panel offers the following parametric maps for selection.
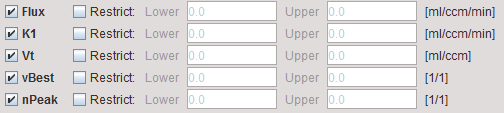
Flux |
Influx into the irreversible compartment, the main result of the model. |
K1 |
Tissue uptake constant. |
Vt |
Total distribution volume of all reversible compartments. |
vBest |
Estimated blood volume fraction in a pixel. |
nPeak |
Number of peaks in the spectrum, whereby immediately neighboring spikes are grouped into a single peak. |
Reference
1. Veronese M, Bertoldo A, Bishu S, Unterman A, Tomasi G, Smith CB, Schmidt KC. A spectral analysis approach for determination of regional rates of cerebral protein synthesis with the L-[1-(11)C]leucine PET method. J Cereb Blood Flow Metab. 2010;30(8):1460-76. DOI