![]()
![]()
![]()
![]()
|
|
|
|
|
The third button  serves for plotting a histogram of a data vector.
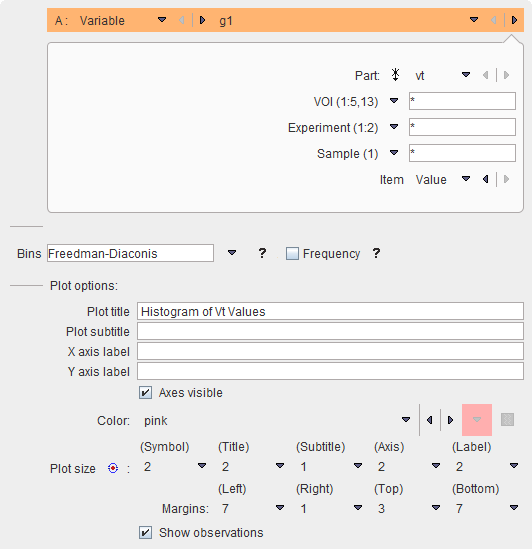
The number of Bins can be entered numerically or automatically calculated by 3 methods (Sturges, Freedman-Diaconis, Scott). The example results in the histogram below.
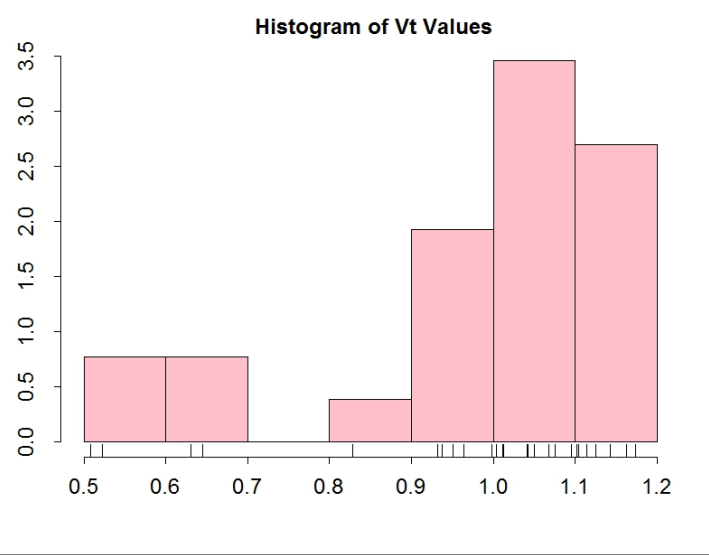
Note the indication of the values and the value ranges because Show observations and Axes visible are enabled.