![]()
![]()
![]()
![]()
|
|
|
|
|
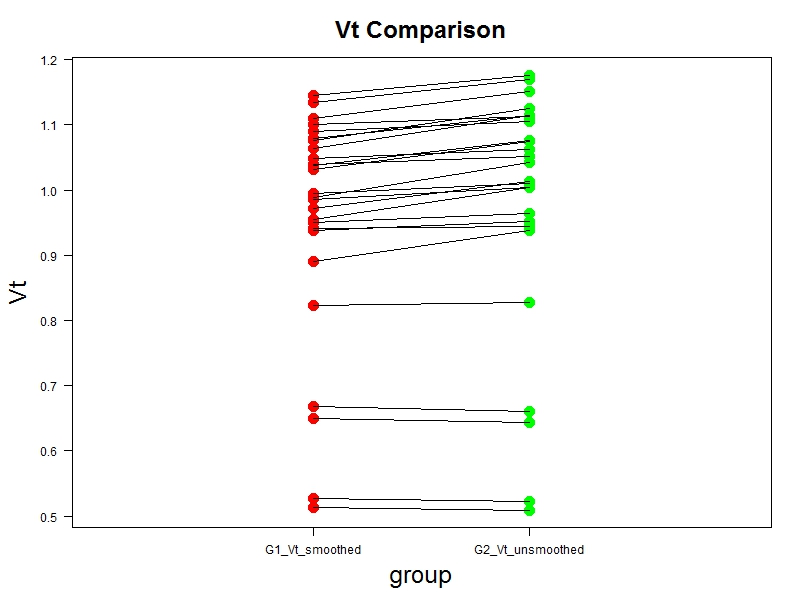
Ladder plots visualize the relation of a test variable in two or more conditions, for instance pre-and post-treatment. It is called with the ![]() button.
button.
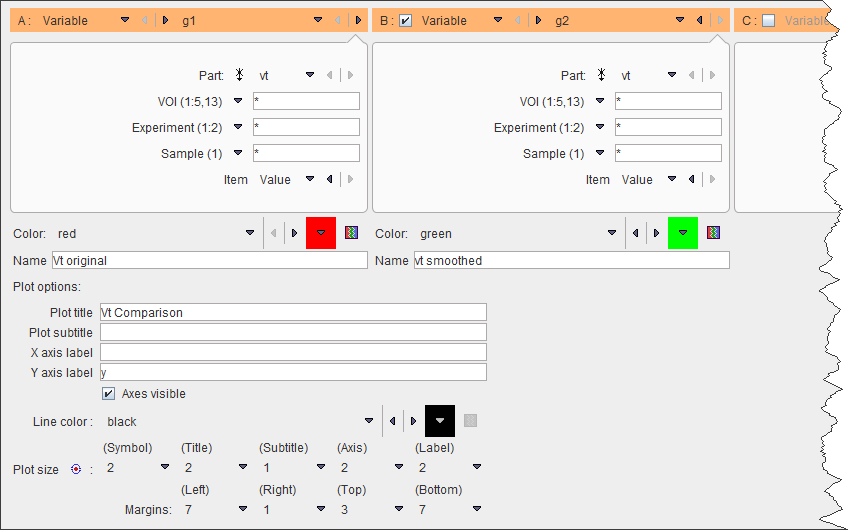
Up to 4 conditions can be connected. However, note that the implementation requires identical ordering of the subjects in the data vectors. The example below illustrates a comparison between two conditions.