![]()
![]()
![]()
![]()
|
|
|
|
|
The first tab in the main controls contains most functions to modify the way how the images and the overlay information look.
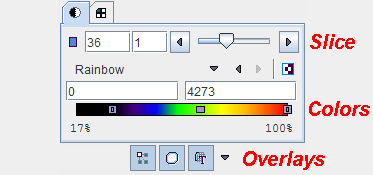
Slice Control
The slice control section allows scrolling through the images using the increment buttons, the slider, or directly by entering a slice number. The value right to the number of the active slice controls incrementing. This is particularly relevant in multi-image layouts. For example, if the increment value is set to 2, only every second image will be displayed.
Instead of selecting slices using the controls, the user can also scroll slices by dragging the left mouse button over the image holding the CTRL key in the Up/Down direction (see the summary of shortcuts below), or with the mouse wheel.
Note: There is a quick way for jumping to the particular slice/frame containing the maximal pixels value: just click the buttons  next to the slice selection.
Color Tables
There is a selection of pre-defined gray and color tables which can be chosen with the list selection
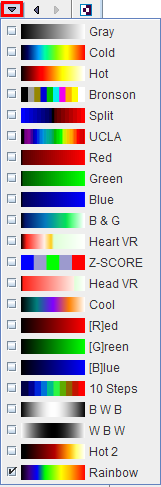
Alternatively, the left and right arrow buttons allow stepping incrementally through the list of color tables. Each color table can be inverted by the  toggle button.
The color table maps a pixel number to a certain color value. There are minimum and maximum threshold values which change the mapping. All pixels with values below the lower threshold will appear with the color at the left end of the color bar, while pixels with values above the upper threshold will appear with the color at the right end. The other pixels will be displayed with a color from the inner of the color bar, depending on the value.
The thresholds can be entered numerically, adjusted by dragging the handles in the color bar, or by mouse dragging directly in the image holding the SHIFT key. Left/Right dragging adjusts the lower threshold, while Up/Down movements adjusts the upper threshold.
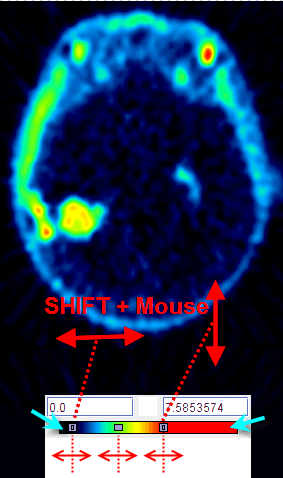
Note: Double-clicking into the lower end of the color bar sets the lower threshold to zero. Double-clicking into the upper end of the color bar sets the upper threshold to the maximum.
Context Menu in Color Table
Clicking the right mouse button into the color bar pops up the context menu
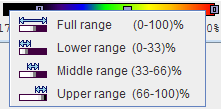
The first entry sets the thresholds to min/max, while the next entries zoom the color table into the lower, middle, upper third of the full range.
Information Overlays and Image Smoothing
The lowest row contains several control buttons which can be on (light color) or off (dark color).
Functionality:
|
Interpolation: Enables image interpolation. Interpolation is needed because in most situations the resolution of the display viewport is higher than the original image matrix.
If the interpolation button is off, the original rectangular pixels are shown. This button is not available in all display windows. Note: the interpolation function only serve for image display enhancement. Statistical analyses are always performed with the original pixel values. |
|
VOI button: Serves for showing/hiding VOIs in the image overlay. This button is not available in all display windows. |
|
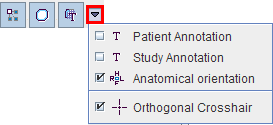
Overlay button: The button itself allows to switch off all overlay information at once. For instance, it can be used to hide the VOI contours to better see the image information. Its associated option menu serves for defining the level of information included in the overlay display. They show a check if they are enabled. |
|
Patient Annotation option: If enabled, demographic patient data is shown in the image overlay. Default: Off. |
|
Study Annotation option: If enabled, information about the study is shown in the image overlay. Default: Off. |
|
Anatomical Orientation option: If this configuration in the overlay button menu is enabled, orientation markers derived from the patient positioning information in the DICOM header are shown with the following meaning: |
|
Orthogonal Crosshair option: If enabled, the blue lines indicating the location of the slices are shown in the orthogonal layout. Default: On. |