![]()
![]()
![]()
![]()
|
|
|
|
|
The slice control section allows scrolling through the images using the increment buttons, the slider, or directly by entering a slice number. The value next to the number of the active slice controls incrementing. This is particularly relevant in multi-image layouts. For example, if the increment value is set to 2, only every second image will be displayed. Please note that there is a quick way for jumping to the particular slice/frame containing the maximal pixels value: just click the button next to the slice/frame selection. Instead of selecting slices using the controls, the user can also scroll slices by dragging the left mouse button over the image holding the CTRL key in the Up/Down direction (see the summary of shortcuts below).
The time control section only becomes active for dynamic studies and behaves the same way as the slice control. To allow for mouse-operated scrolling over time, the time box on the left side below the image must first be checked.

There is a selection of pre-defined gray and color tables which can be chosen with the list selection
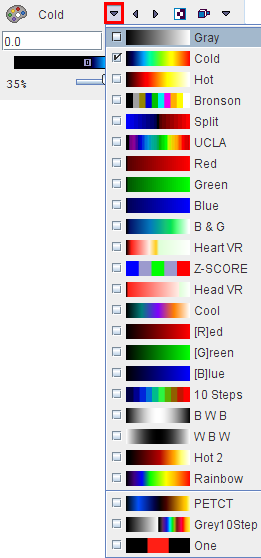
Note: User defined color tables can be added by creating a 3-column text file with the RGB values and saving it to the sub-directory resources/colortables (see the examples there). They are appended to the lower section of the list.
A minimal/maximal threshold value defines what the range of displayed values is. The thresholds can be entered numerically, or the handles in the color bar can be dragged with the mouse. Additionally, the user can modify them by dragging the left mouse button over the image holding the SHIFT key. Left/Right movements modify the lower threshold, while Up/Down movements modify the upper window.
In some cases, the range of image values of interest only covers a small part of the color bar which makes it difficult to adjust the brightness precisely. In this situation, the user can zoom the color bar into the current sub-range of values. Clicking the right mouse button into the color bar pops up the context menu
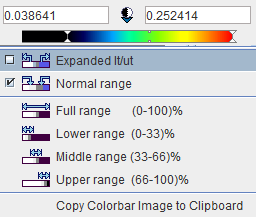
The first menu entry Expand lt/ut then performs the desired task and makes the color bar change to
![]()
The second entry performs the reverse operation, and the other entries are just shortcuts which may be helpful. If a window/level setting has been defined in a DICOM data set, this definition is added to the list using a specific name, or W1 if such a name was not available as in the example.
The following modes are available for the color table application:
|
Inversion of the color table. |
|
Slice mode: The same % threshold is applied to each individual slice. Hereby the dynamic color range is fully exploited. However, the same color will represent a different value in different slices. Therefore, this mode is not recommended in most cases. |
|
Volume mode: With this setting, the minimal/maximal value in an entire volume is determined, and the % threshold applied to them. As a consequence, the colors represent fixed values when inspecting the slices of a volume. However, as the absolute minimal/maximal value will vary at different times of a dynamic acquisition, the same color will most likely represent different values when comparing different frames. This setting is recommended for static studies. |
|
Fixed mode: This setting requires the user to enter the minimal/maximal value. The same absolute threshold will be applied for all slices and times. This is the recommended setting for dynamic studies and when running movies over time frames. |


