![]()
![]()
![]()
![]()
|
|
|
|
|
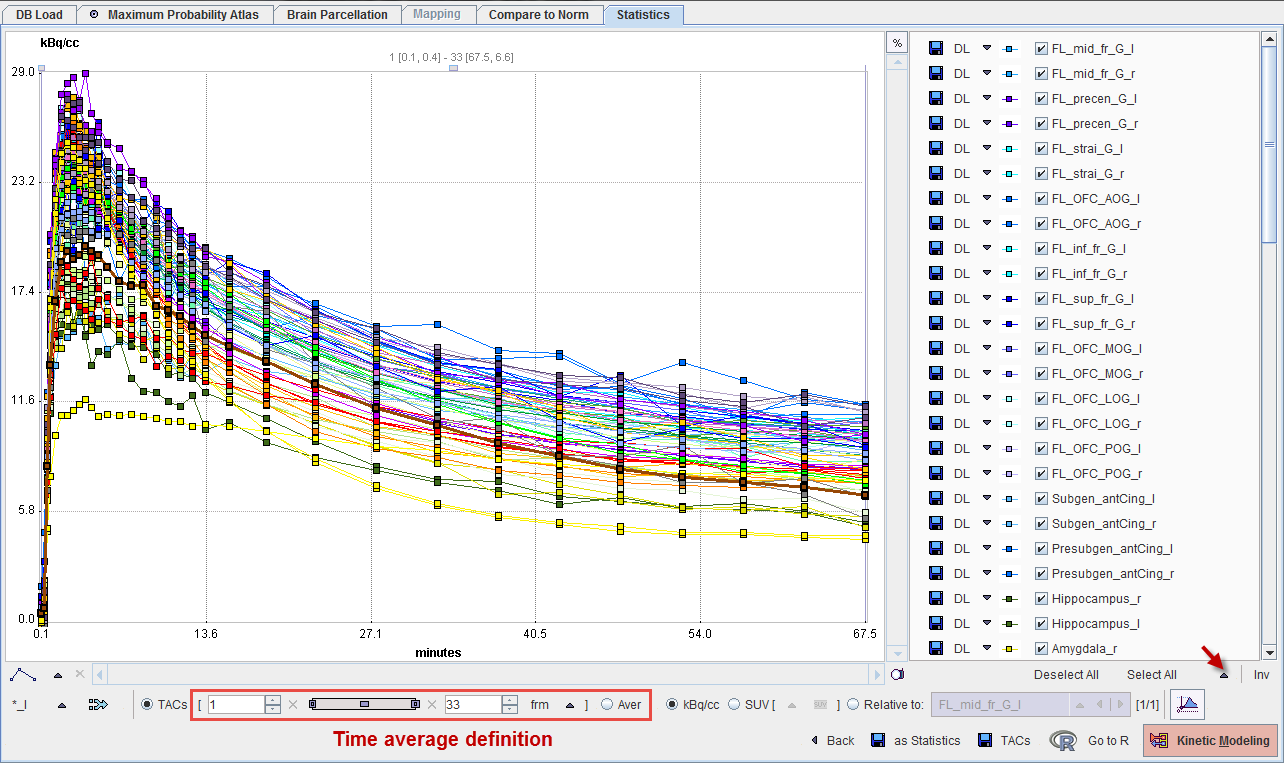
The example below illustrates the result of deriving brain VOIs by a T1-weighted MRI parcellation, and applying them to a dynamic raclopride PET in order to calculate regional TACs.
The Back arrow in the lower part is a convenience button for switching back to the PNEURO module which generated the statistics.
Selection of Curve Subsets
The PNEURO tools create a large number of VOIs. Sometimes, only a subset may be relevant for further processing. In this case the VOIs of interest are preferably selected on the VOIs page before calculating the actual statistics.
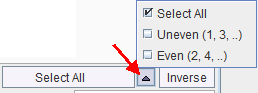
An alternative is to select the relevant curves in the list to the right. There are some convenience buttons supporting this selection: Deselect All switches all curves off. Select All switches all curves on. Inverse inverts the current selection. Note the arrow button which allows to quickly select dedicated subsets.
For instance, if the optional partial-volume correction is enabled for the statistics calculation there will be pairs of curves for all VOIs: one curve representing the original data, and one curve ending with _C representing the partial volume corrected data.
Transfer of TACs to the PKIN Tool
The Kinetic Modeling button allows directly transferring dynamic tissue TACs to the PKIN tool for modeling. It opens the following dialog window.
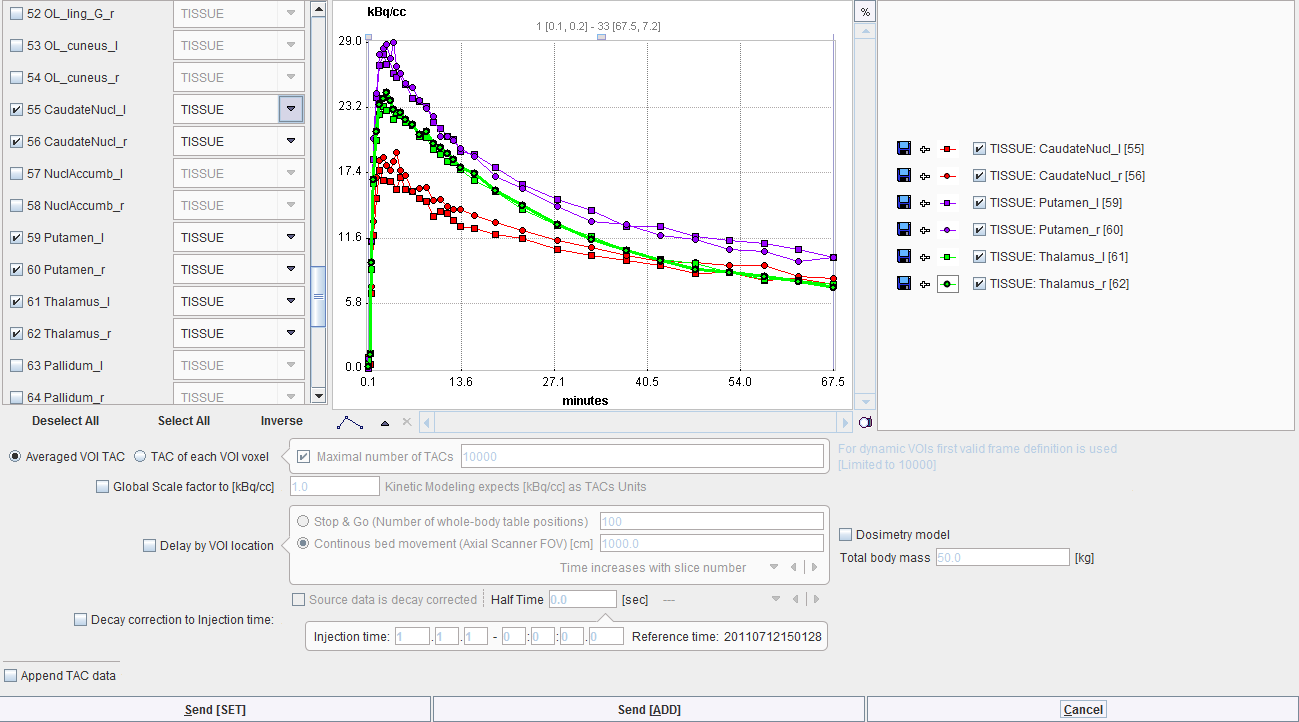
The TACs to be transferred can be selected by checking the box in the left column. The right side lists the currently selected TACs. Send [SET] transfers the selection to the active workspace in PKIN. If the Append TAC data is enabled, the TACs will be added as additional tissue regions, otherwise the existing tissue data is overwritten. Send [ADD] first creates a new workspace in PKIN before actually transferring the selection.
Saving the Statistics
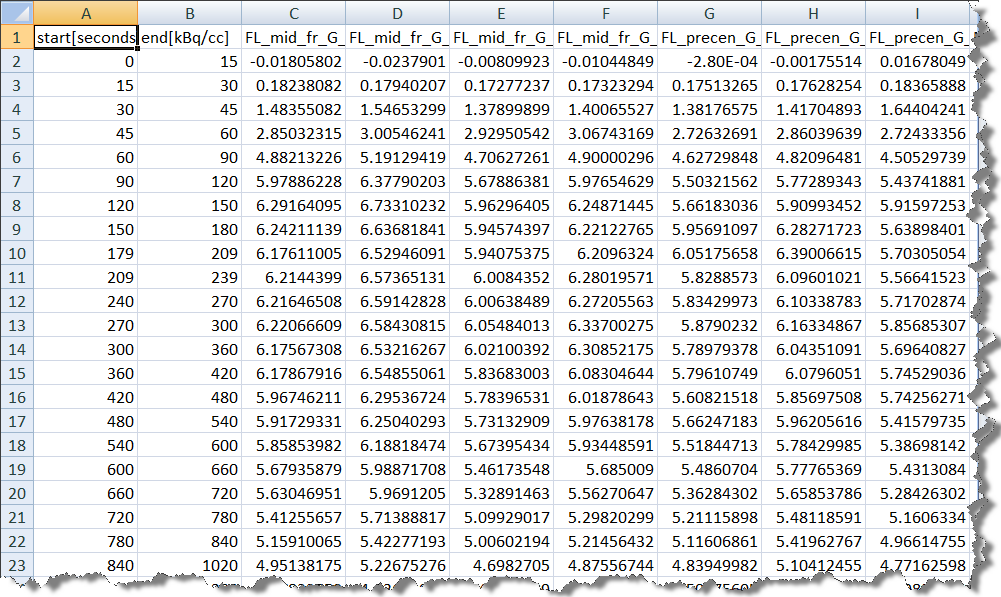
The Save TACs button allows saving all curves in a simple tab-delimited text file as illustrated below. Such a file can easily be imported into other programs for processing and visualization.
Save as Statistics allows storing the information in a format suitable for statistical analysis.
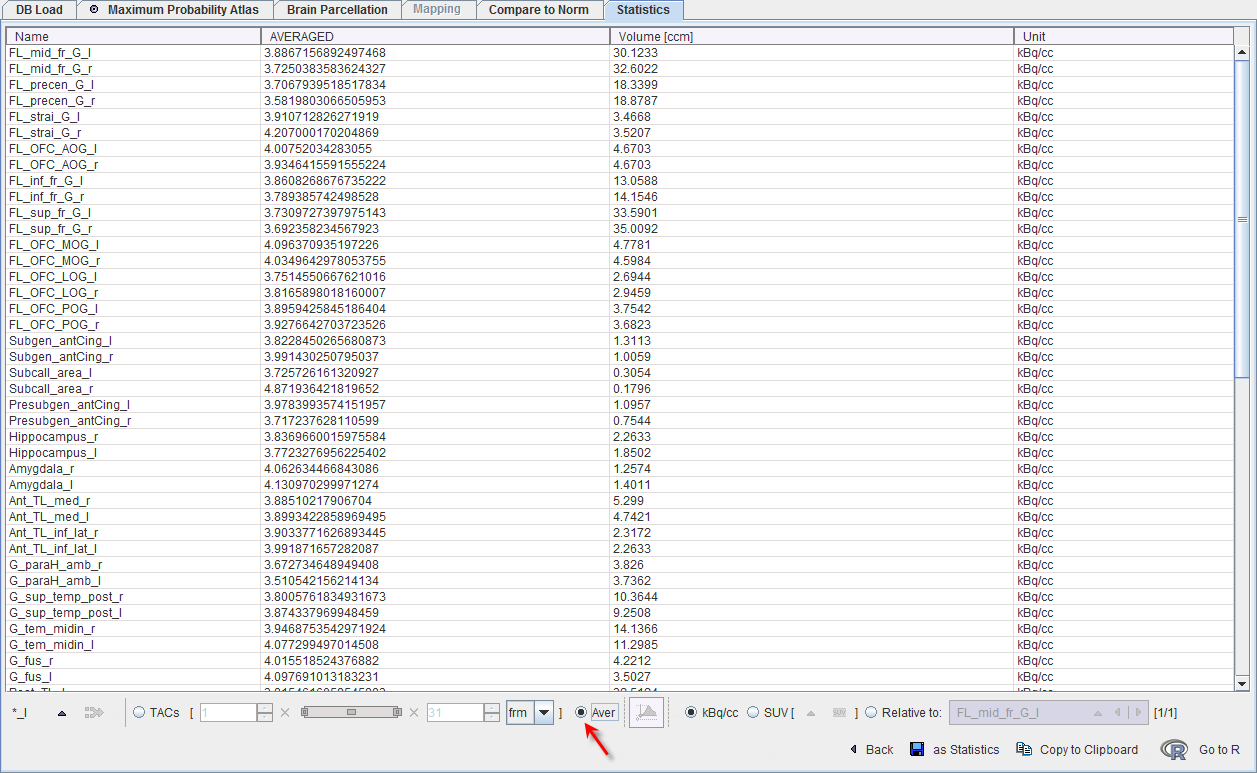
Average in Frame Range
For dynamic data there is an easy way to calculate the average regional uptake in the regions in a certain frame range: with the TACs radio button selected define the range to be averaged. As soon as the Aver radio button is switched on the uptake statistics is calculated and listed, replacing the curves display.
Average TACs
The Merge (volume weighted) the selected VOI button  allows averaging the selected TACs. When the Selected option is activated a confirmation window appears. It allows defining the name for the new TAC.
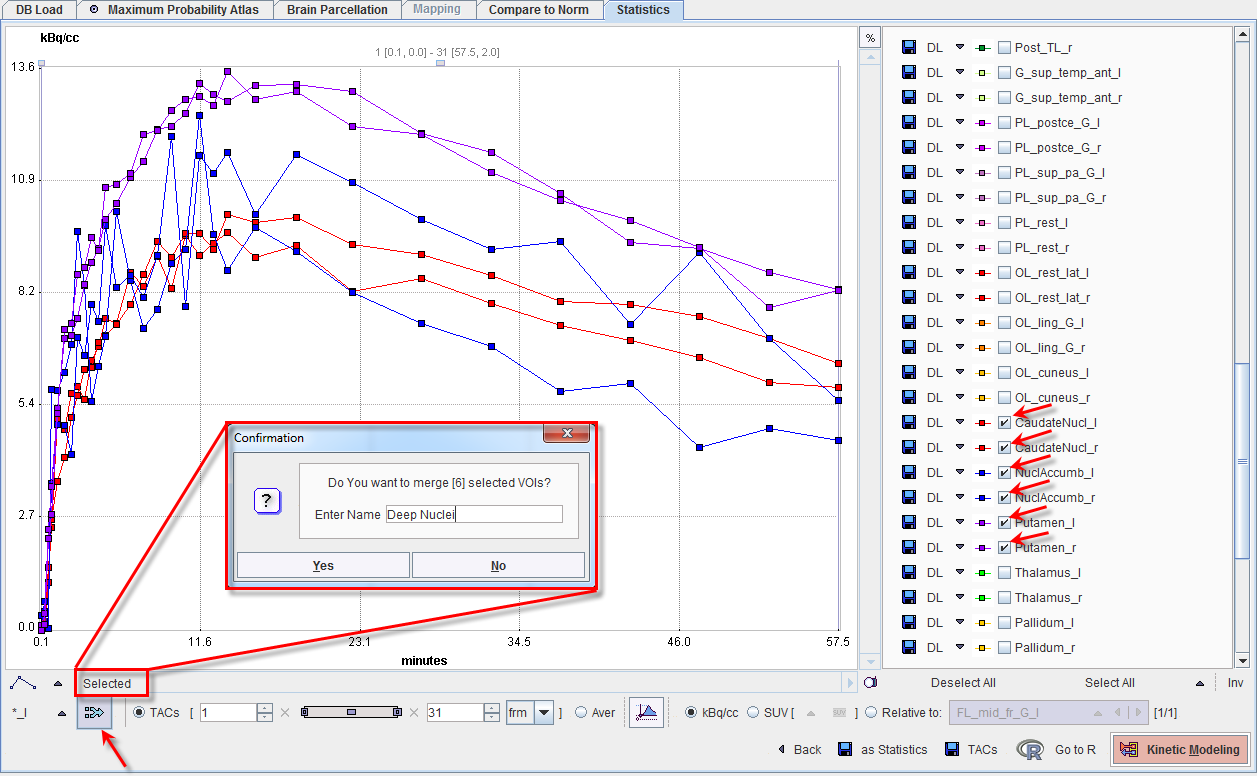
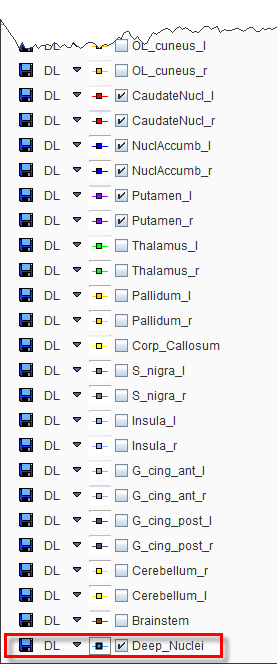
As soon as the OK button is pressed the new TAC is calculated and appended at the bottom of the currently available TACs list.
Transfer of Statistics to R
The Go to R button transfers the average and volume statistics of the selected TACs to the R server, generating one R variable in the R workspace.