![]()
![]()
![]()
![]()
|
|
|
|
|
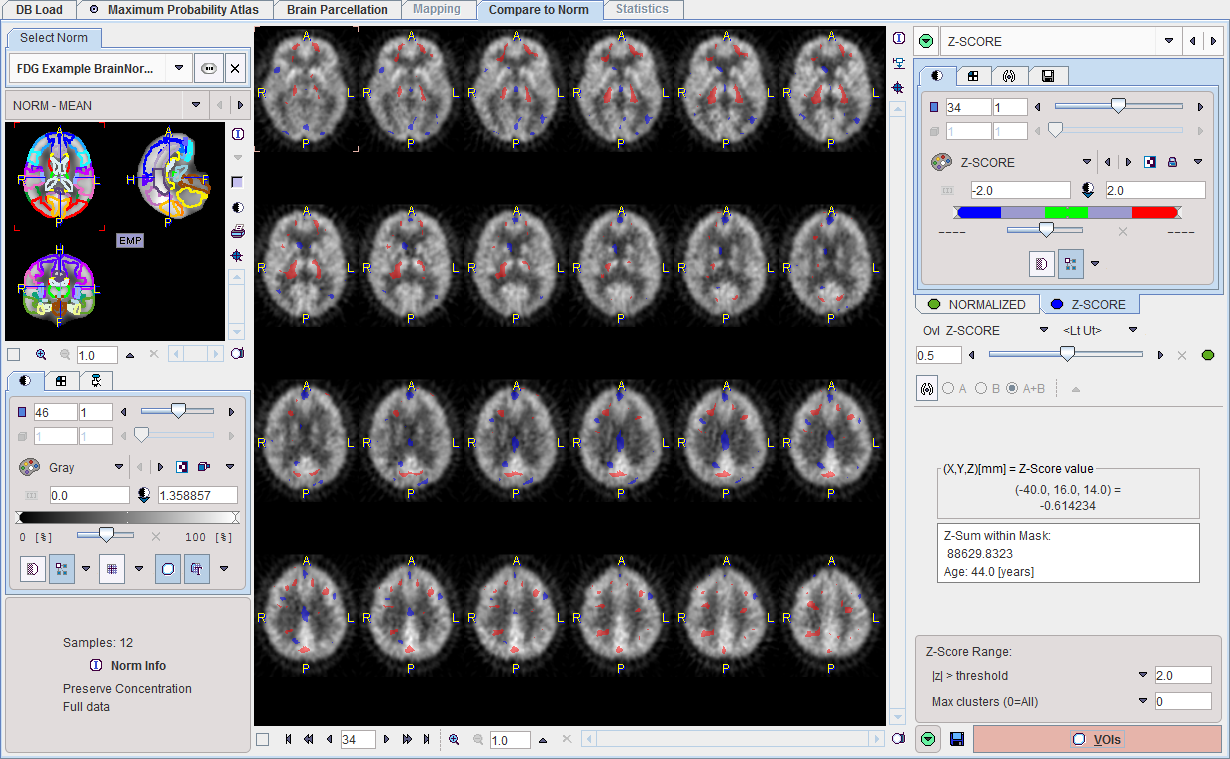
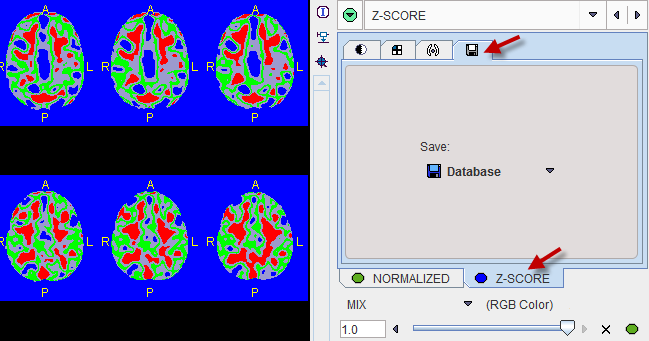
The result of the z-score calculation is shown on the Z-SCORE page as a fusion of the NORMALIZED patient image with the Z-SCORE image map.
The z-score defines the deviation of a sample with respect to the mean of a distribution. It is defined by the formula
z = (x-m)/s
where x is the sample value, m the sample mean, and s the standard deviation of the distribution. Therefore z describes the deviation from the mean in number of standard deviations and is positive, when the sample is above the mean, and negative when below.
Z-Score Thresholds
Per default the Z-SCORE image is shown with a dedicated color table as illustrated below. It will show all pixels with values below the lower threshold in blue, and pixels above the upper threshold in red.
To allow a clear view of the z-score clusters on the normalized patient images the default fusion mode is set to OVL B with filter <Lt Ut>. This means that only Z-SCORE pixels with values below/above the lower/upper thresholds are shown. These thresholds are updated by any change in the Z-Score Range settings.
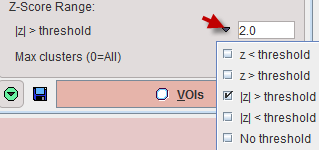
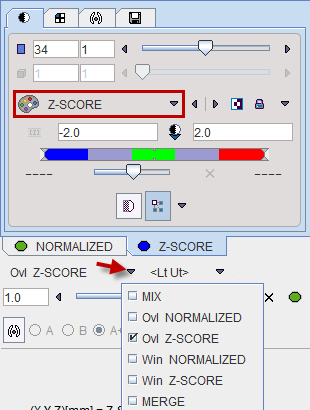
The threshold can be entered numerically, whereas the filtering criterion can be selected from a list. In this way z-score pixels below a threshold, above a threshold, or with an absolute value beyond the threshold can be shown.
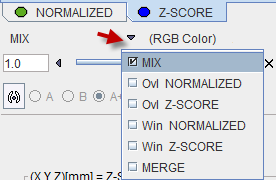
The setting No threshold removes any data filtering. In this case the fusion mode should be switched to MIX in order to actually see the full z-score map. This setting should also be selected for saving the unfiltered z-score map.
Saving Results
The Z-SCORE panel has a dedicated tab for saving the currently shown z-score map for use in another context. Configure the appropriate image format, and then select the Save button for saving.
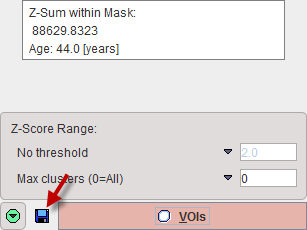
The program always calculates the sum of all z-score values within in the result mask. This information is displayed together with the age of the patient. It can be saved to the database or a text file using the saving button indicated below.
When the  button is activated, a dialog window pops up showing two minimized report pages, one with the current image display as illustrated below, the other containing a summary of the Brain Norm parameters.

Select the page of interest in the Pages section. It can be annotated, printed, and saved as a JPEG/TIFF file or as a DICOM secondary capture object.
VOI Statistics of z-score Values
The z-score maps can be used for VOI statistics calculation. To do so, please activate the VOIs action button in the lower right.
3D Rendering (Option)
If the 3D option has been purchased and installed the button  is available in the lateral taskbar and can be used to rapidly transfer the NORMALIZED patient images and the Z-SCORE map to the 3D tool. Rendering is immediately initiated and a result shown such as the example below.
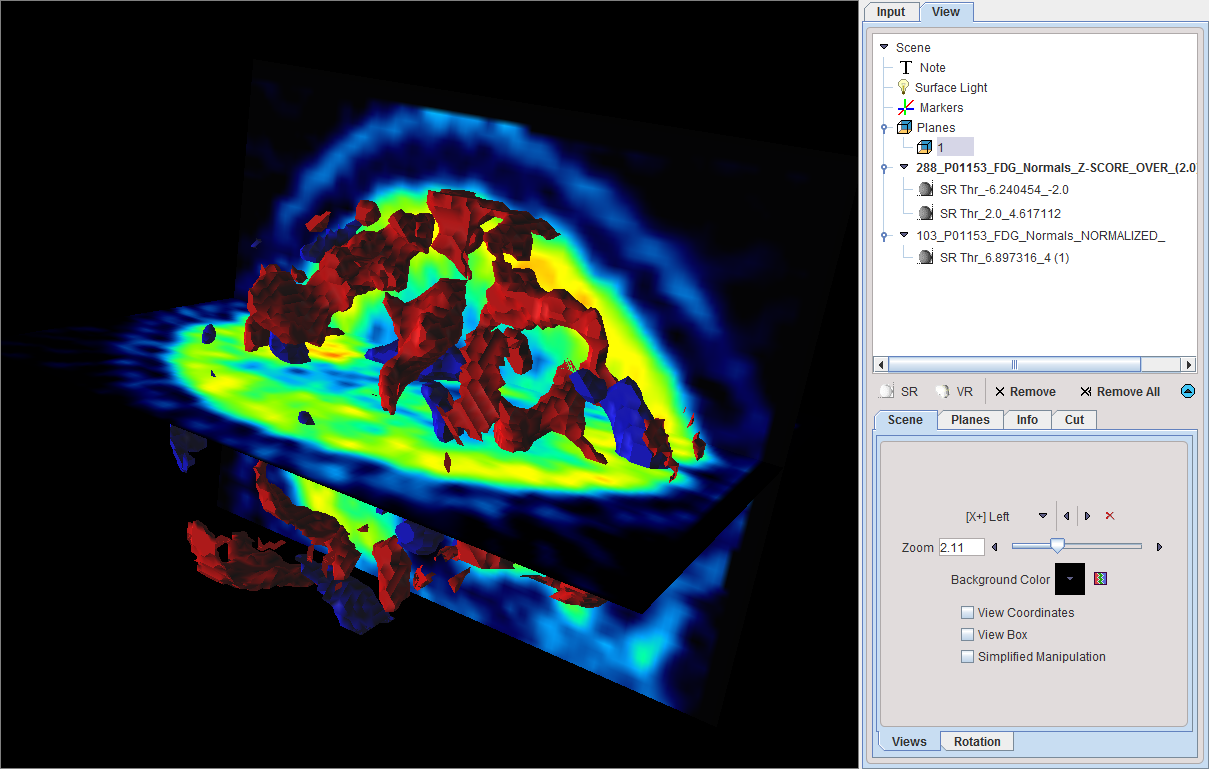
Here the truncated z-score maps were calculated with |z|>2. Therefore, the red objects enclose all areas with a z-score above 2, while the blue objects enclose the areas with z-score below -2. The scene can interactively be rotated and zoomed. Additionally, more information can be added, for example the brain shape, and/or planes of the normalized images.