![]()
![]()
![]()
![]()
|
|
|
|
|
This model was developed by Alpert et al. [1] to extend the concept of activation studies for including measurements targeting neurotransmitters and specific receptor populations. It uses the fact that cognitive activation increases neuronal firing rate, hereby increasing the endogenous neurotransmitter level and altering the kinetics of specifically bound radioligands. The methodology uses a single PET injection. The scan starts with an acquisition of the subject at rest (baseline), followed by an acquisition with the subject performing a task (activation). The data (after motion correction of the lengthy scan) is analyzed modeling the change of the endogenous neurotransmitter level as an effect which occurs immediately after the task onset, and diminishes exponentially over time. The method has been applied to [11C]raclopride [1] and more recently to [18F]fallypride data [2,3].
Note: The model has been called LSSRM [1,2] and LSRRM [3], but was renamed to LSRTM to correspond to the commonly used notation of the Simplified Reference Tissue Model SRTM.
Model Configuration and Assumptions
The model uses the same assumptions as the Simplified Reference Tissue Model (SRTM):
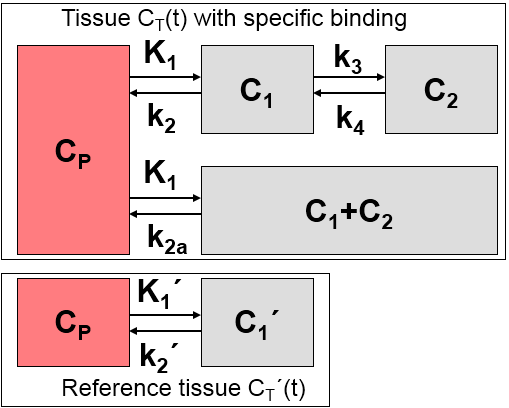
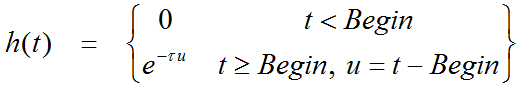
Additionally, it is assumed that at the onset of the activation, k2a is increased by the amplitude g of ligand displacement, and that the effect dies away with a decay constant t. This behavior is described by a time-dependent k2a as follows:
![]()
Operational Model Curve
Defining the ratio of tracer delivery R1 as K1/K1', the following operational equation can be derived for the measured tissue TAC in a receptor-rich region:
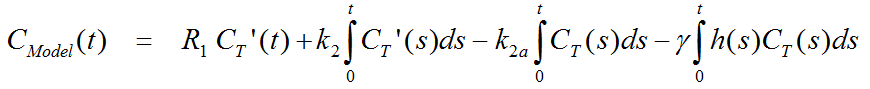
For the parametric mapping it is assumed that t is constant, so that the equation can be solved using multi-linear regression. From the resulting parameters the binding potential BPND can be calculated as
![]()
The main outcome of the model, however, is the amplitude g of ligand displacement, for which a t-score value and its p-value for a one-tailed t-test are also provided.
Acquisition and Data Requirements
Image Data |
A dynamic PET data set with a baseline part and an activation part. Due to the extended length, motion correction should have been applied. |
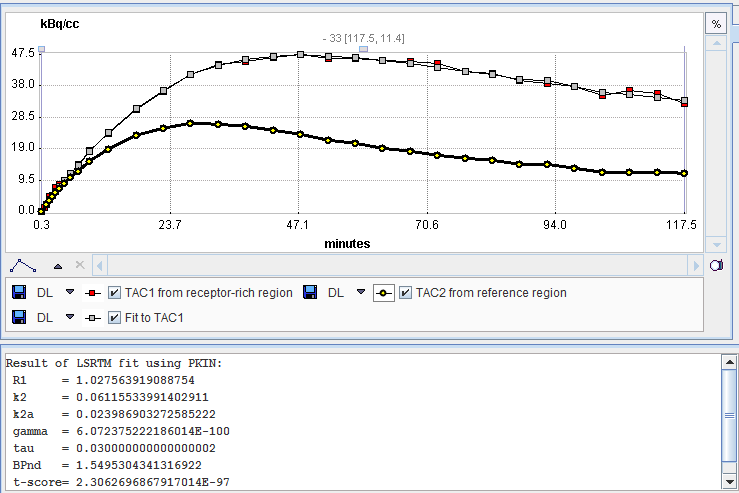
TAC 1 |
TAC from a receptor-rich region (such as basal ganglia for D2 receptors). |
TAC 2 |
TAC from a receptor-devoid region (such as cerebellum or frontal cortex for D2 receptors). |
Model Preprocessing
Two regional TACs (TAC1 and TAC2) are needed for Model Preprocessing. The iterative LSRTM procedure implemented in PKIN is applied to fit the enabled parameters.
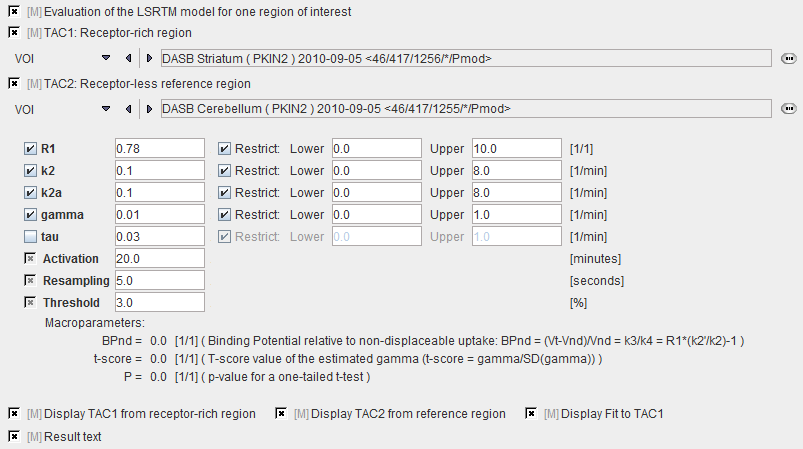
R1 |
Relative delivery: R1 = K1/K1'. |
k2 |
Tissue to plasma efflux constant in target tissue. |
k2a |
Apparent k2 of the target tissue (k2a=k2/(1+BPnd)) |
gamma |
Amplitude of ligand displacement. |
tau |
Decay constant controlling how the activation effect dies away. The value can be fitted in pre-processing, but is usually fixed. Default: 0.03min-1. This value will be applied in the pixel-wise fitting. |
Activation |
Time relative to the scan start when the activation task was started. |
Resampling |
Interval of the curve resampling which is required for performing the operation of exponential convolution. Should be equal or smaller than the shortest frame duration. |
threshold |
Discrimination threshold for background masking. |
The result of the fit during Model Preprocessing is shown in the Result panel for inspection.
Model Configuration
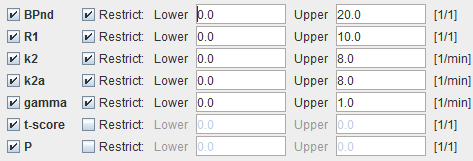
BPnd |
Estimated binding potential (BPnd= k3/k4 according to the underlying model). |
R1 |
Ratio of tracer delivery in each pixel relative to the reference tissue (R1=K1/K1'). Therefore the map often has a similar appearance to a perfusion image. |
k2 |
Estimated efflux rate constant k2 . |
k2a |
Apparent k2 of the target tissue (k2a=k2/(1+BPnd)) |
gamma |
Amplitude of ligand displacement. |
t-score |
t-score value of gamma. |
P |
t-score value converted to a p-value for a one-tailed t-test. |
References
[1] Alpert NM, Badgaiyan RD, Livni E, Fischman AJ. A novel method for noninvasive detection of neuromodulatory changes in specific neurotransmitter systems. Neuroimage. 2003;19(3):1049-60. DOI
[2] Christian BT, Lehrer DS, Shi B, Narayanan TK, Strohmeyer PS, Buchsbaum MS, Mantil JC. Measuring dopamine neuromodulation in the thalamus: using [F-18]fallypride PET to study dopamine release during a spatial attention task. Neuroimage. 2006;31(1):139-52. DOI
[3] Ceccarini J, Vrieze E, Koole M, Muylle T, Bormans G, Claes S, Van Laere K. Optimized in vivo detection of dopamine release using 18F-fallypride PET. J Nucl Med. 2012;53(10):1565-72. DOI